Basic Concepts
The Kuder and Richardson Formula 20 test checks the internal consistency of measurements with dichotomous choices. It is equivalent to performing the split-half methodology on all combinations of questions and is applicable when each question is either right or wrong. A correct question scores 1 and an incorrect question scores 0. The test statistic is
where
k = number of questions
pj = number of people in the sample who answered question j correctly
qj = number of people in the sample who didn’t answer question j correctly
σ2 = variance of the total scores of all the people taking the test = VAR.P(R1) where R1 = array containing the total scores of all the people taking the test.
Values range from 0 to 1. A high value indicates reliability, while too high a value (in excess of .90) indicates a homogeneous test (which is usually not desirable).
Kuder-Richardson Formula 20 is equivalent to Cronbach’s alpha for dichotomous data.
Example
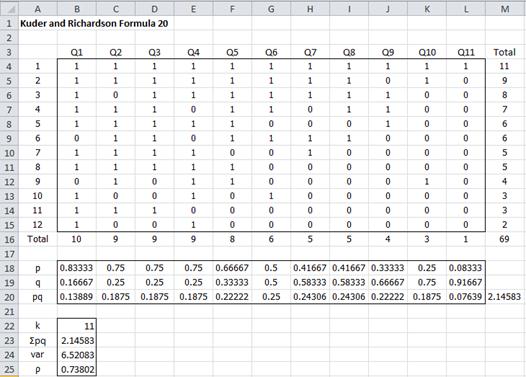
Example 1: A questionnaire with 11 questions is administered to 12 students. The results are listed in the upper portion of Figure 1. Determine the reliability of the questionnaire using Kuder and Richardson Formula 20.
Figure 1 – Kuder and Richardson Formula 20 for Example 1
The values of p in row 18 are the percentage of students who answered that question correctly – e.g. the formula in cell B18 is =B16/COUNT(B4:B15). Similarly, the values of q in row 19 are the percentage of students who answered that question incorrectly – e.g. the formula in cell B19 is =1–B18. The values of pq are simply the product of the p and q values, with the sum given in cell M20.
We can calculate ρKR20 as described in Figure 2.
Figure 2 – Key formulas for worksheet in Figure 1
The value ρKR20 = 0.738 shows that the test has high reliability.
Worksheet Function
Real Statistics Function: The Real Statistics Resource Pack provides the following function:
KUDER(R1) = KR20 coefficient for the data in range R1.
For Example 1, KUDER(B4:L15) = .738.
KR-21
Where the questions in a test all have approximately the same difficulty (i.e. the mean score of each question is approximately equal to the mean score of all the questions), then a simplified version of Kuder and Richardson Formula 20 is Kuder and Richardson Formula 21, defined as follows:
where μ is the population mean score (obviously approximated by the observed mean score).
For Example 1, μ = 69/12 = 5.75, and so
Note that ρKR21 typically underestimates the reliability of a test compared to ρKR20.
Examples Workbook
Click here to download the Excel workbook with the examples described on this webpage.
References
Wikipedia (2012) Kuder-Richardson formulas
https://en.wikipedia.org/wiki/Kuder%E2%80%93Richardson_formulas


If the test was to be a standardised test with 6,000 participants, and those that got each item right was between 3,000 and 4,500 per item. Compute the KR reliability coefficient.
Hello Danladi,
Sorry, but I don’t understand your comment. Do you have a question?
Charles
Assuming you have five test items responded to by ten examinees on a polytonous test item generate the scores (performance) and determine the reliability coefficient using kuder Richardson formular
Do you mean “polytomous”?
If so what is the problem with using Kuder-Richardson?
Charles
Please interprete B4:B15
Hello Chioma,
For this example, there are 12 students, each of whom answered question Q1. A correct answer (for any student) is assigned the value 1 and an incorrect answer is assigned the value 0.
Charles
Serial number
How did you result to the answer in cell B18?
Samuel,
As stated on the webpage, B18 contains the formula =B16/COUNT(B4:B15).
Charles
sory Dr, am get confusing on how to calculate variancein KR20 out of excell work
What is confusing you?
Charles
Please sir, what is the sample size?
For dichotomous data, i.e. the type of data supported by Kuder and Richardson Formula 20 (KR20), KR20 is equivalent to Cronbach’s alpha. Thus, you can use the estimates for the sample size for Cronbach’s alpha.
See https://www.real-statistics.com/reliability/internal-consistency-reliability/cronbachs-alpha/cronbachs-alpha-power/
Charles
Dear professor,
First, thanks for the effort of this project. I try my best to search the code for KR20 or KUDER(R1) but, i didn’t find any in the dialog box. Could you advise me on this matter.
Thanks
Fadzli
Dear Fadzli,
For dichotomous data (i.e. consisting only of 0’s and 1’s), KR20 is equivalent to Cronbach’s alpha. You can therefore use the Cronbach’s alpha dialog box.
Charles
Why do you use the variance of the population rather than the variance of the sample? Also, I am confused why the p, q values are represented as a ratio (total correct or incorrect responses divided by the total number of possible correct/incorrect responses per question (e.g. 10/12 = 0.8333) but the variance represents the dispersion of the number of questions answered correctly per participant (not a ratio).
Hi Katherine,
You can use either the sample or population version (as long as you don’t mix them). You should get the same result.
I don’t know why p and q are ratios and the others are not. It is just the way the math works out.
Charles