Basic Concepts
Cohen’s kappa accounts for disagreement between the two raters but not for the degree of disagreement. This is especially relevant when the ratings are ordered (as they are in Example 2 of Cohen’s Kappa).
To address this issue, a modification of Cohen’s kappa, called weighted Cohen’s kappa, is used. Weighted kappa is calculated using a predefined table of weights that measures the degree of disagreement between the two raters. The higher the disagreement, the higher the weight. The table of weights should be a symmetric matrix with zeros in the main diagonal (specifying agreement between the two judges) and positive values off the main diagonal. The farther apart the judgments are, the higher the weights assigned.
We now describe how to do this for Example 2 of Cohen’s Kappa, where we have reordered the rating categories from highest to lowest to make things a little clearer. We will use a linear weighting, although higher penalties can be assigned, for example, to the Never × Often assessments.
Example
Example 1: Repeat Example 2 of Cohen’s Kappa using the weights in range G6:J9 of Figure 1, where the weight of disagreement of Never × Often is twice the weights of the other disagreements.

Figure 1 – Weighted kappa
We first calculate the table of expected values (assuming that outcomes are by chance) in range A14:E19. This is done exactly as for the chi-square test of independence. E.g. cell B16 contains the formula =B$10*$E7/$E$10.
The weighted value of kappa is calculated by first summing the products of all the elements in the observation table by the corresponding weights and dividing by the sum of the products of all the elements in the expectation table by the corresponding weights. Since the weights measure disagreement, weighted kappa is then equal to 1 minus this quotient.
For Example 1, the weighted kappa (cell H15) is given by the formula
=1-SUMPRODUCT(B7:D9,H7:J9)/SUMPRODUCT(B16:D18,H7:J9)
Unweighted Kappa
Note that we can assign all the weights on the main diagonal to be 0 and all the weights off the main diagonal to be 1. This provides another way to calculate the unweighted kappa, as shown in Figure 2.

Figure 2 – Unweighted kappa
Formulas
Using the notation from Cohen’s Kappa where pij are the observed probabilities, eij = piqj are the expected probabilities, and wij are the weights (with wji = wij)
![]()
We can now use the following formula to calculate the standard error:

where
![]()
![]()
![]()
Note too that the weighted kappa can be expressed as
![]()
where
![]()
From these formulas, hypothesis testing can be done and confidence intervals calculated, as described in Cohen’s Kappa.
Worksheet Function
Real Statistics Function: The Real Statistics Resource Pack contains the following function:
WKAPPA(R1, R2, lab, alpha) = returns a 4 × 1 array with values kappa, the standard error, and left and right endpoints of the 1 – alpha confidence interval. alpha defaults to .05. R1 contains the observed data (formatted as in range M7:O9 of Figure 2) and R2 contains the weights (formatted as in range S7:U9 of the same figure).
If R2 is omitted, it defaults to the unweighted situation where the weights on the main diagonal are all zeros and the other weights are ones. R2 can also be replaced by a number r. A value of r = 1 means the weights are linear (as in Figure 1), and a value of 2 means the weights are quadratic. In general, this means that the equivalent weights array would contain zeros on the main diagonal and values (|i−j|)r in the ith row and jth column when i ≠ j.
If lab = TRUE, then WKAPPA returns a 4 × 2 array, where the first column contains labels that correspond to the values in the second column. The default is lab = FALSE.
Referring to Figure 1 and 2, we have WKAPPA(B7:D9,G6:J9) = WKAPPA(B7:D9,1) = .500951 and WKAPPA(M7:O9) = .495904. If we highlight a 4 × 2 range and enter WKAPPA(B7:D9, G6:J9,TRUE,.05), we obtain the output in range Y7:Y10 of Figure 3. For WKAPPA(M7:O9,,TRUE,.05), we obtain the output in range AA8:AB11 of Figure 7 of Cohen’s Kappa.
Data Analysis Tool
Real Statistics Data Analysis Tool: We can use the Interrater Reliability data analysis tool to calculate Cohen’s weighted kappa.
To do this for Example 1, press Ctrl-m and choose the Interrater Reliability option from the Corr tab of the Multipage interface, as shown in Figure 2 of Real Statistics Support for Cronbach’s Alpha.
If using the original interface, then select the Reliability option from the main menu and then the Interrater Reliability option from the dialog box that appears, as shown in Figure 3 of Real Statistics Support for Cronbach’s Alpha.
In either case, fill in the dialog box that appears (see Figure 7 of Cohen’s Kappa) by inserting B7:D9 in the Input Range and G7:J9 in the Weights Range. Make sure that the Column headings included with data option is not selected. Also, choose the Weighted Kappa option. The output is shown on the left side of Figure 3.
Alternatively, you can simply place the number 1 in the Weights Range field. If instead, you insert 2 in the Weights Range field (quadratic weights), you get the results on the right side of Figure 3.
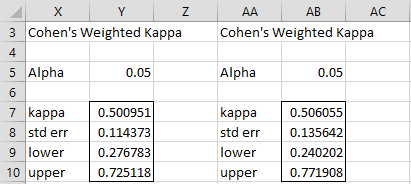
Figure 3 – Weighted kappa with linear and quadratic weights
Examples Workbook
Click here to download the Excel workbook with the examples described on this webpage.
Links
References
Fleiss, J. L., Cohen, J, Everitt, B. S. (1969) Large sample standard errors of kappa and weighted kappa. Psychological Bulletin.
https://www.semanticscholar.org/paper/Large-sample-standard-errors-of-kappa-and-weighted-Fleiss-Cohen/f2c9636d43a08e20f5383dbf3b208bd35a9377b0
Fleiss, J. L., Cohen, J. (1973) Equivalence of weighted kappa and the intraclass correlation coefficient as measures of reliability. Educational and Psychological Measurement
https://psycnet.apa.org/record/1974-04128-001
Hello Dr. Zaiontz,
I’m conducting a weighted kappa analysis and wasn’t sure how I would deal with cells that have observed and expected frequencies of 0.
For example, if rater A rated all 3 categories (low, medium, high) but rater b only rated 1 category (high). Would it be appropriate to introduce a constant (eg. 0.001) in the 2×2 table instead of 0 in the cells to ensure that there I can calculate weighted kappa, se and 95% CI?
Thanks in advance for the response! Hope to hear from you soon!
Hello Mel,
The example shown in Figure 1 on this webpage has an observed frequency of 0. I don’t understand how you got an expected frequency of 0.
Can you share with me the values in your table?
Charles
Here are the values in my table.
Rater B
Rater A –Low — Medium — High
Low — 0 —— 15 —— —- 10
Medium– 0 —- 16 ———— 5
High — 0 —- 0————-0
In this example, we wouldn’t be able to calculate the standard error and 95% CI due to zeros in the denominator. Would you suggest using 0.001 instead of zeros or another approach here?
Hello Mel,
I have never seen this situation before, and can’t say for sure. I would try .001 and see whether the results make sense.
Charles
Hi Charles,
Using 0.001 instead of 0 yields results (se & 95%CI). I think intuitively you’d expect no agreement beyond chance here due to the zero cells. Right?
The kappa is essentially zero and the se is very small (little to no variability) when I used these values in your excel document.
I’m not sure if these results are worthwhile disseminating? Would love your thoughts.
Mel,
See my latest response to your previous comment.
Charles
Hello Mel,
If you are using unweighted Cohen’s kappa, then the situation is similar to Example 1 on
https://real-statistics.com/reliability/interrater-reliability/cohens-kappa/
except that range B5:D7 contains your values. I didn’t need to replace the zeros by .001 in order to get standard error values.
The results were kappa = .05802, se = .04849, 95% CI (-.03702, .15306).
Charles
How to calculate the sample size for Weighted Kappa and more than two evaluators?
Augusto,
Weighted Kappa can only be used with two evaluators. There are other approaches when you have more than two evaluators (ICC, Gwet’s AC2, etc.).
Charles
Hi Everyone,
I am also doing an analysis with kappa statistics in SPSS, but want to perform a bootstrap method. Unfortunately, I cannot find how to do this. Does anyone know how to do that in SPSS while performing kappa statistics.
Hi Zahra,
The following webpage explains how to use bootstrapping to construct a confidence interval for Cohen’s kappa.
https://stats.stackexchange.com/questions/439329/nonparametric-bootstrap-to-construct-confidence-intervals-for-cohens-kappa-coef
I don’t use SPSS and so don’t know how to do this in SPSS. I can do this in Excel using Real Statistics capabilities. In fact, I plan to add an example to the Real Statistics website showing how to do this.
Charles
Hi Charles!
Thank you for all the information on your website!
I am doing a study with 3 observers who are qualifying if the cartilage is broad, narrow or narrower on ultrasound. And if the bone is well developed or blunt. Would you suggest weighted kappa as the correct test to measure reliability?
Hi Bhushan,
Glad you like the website.
Weighted kappa can only be used with two raters. With 3 raters, you can use Fleiss’ kappa, Gwet’s AC2, or a number of other measurements. All are described on the Real Statistics website.
Charles
Hello Charles,
Thank you for your reply. I have downloaded the real-statistics data analysis tool on Excel for Mac. However, When I try to run the formula, the output range shows an error in the formula name (#NAME?) and I cannot see the results.
This happened even in your Examples workbook. Can you please guide me?
Most likely you still need to install the Real Statistics add-in. The instructions for doing this are given on the same webpage from where you downloaded the Real Statistics add-in.
Charles
Thank you.
I have another question if I may.
To recap, I am doing a study with 3 observers qualifying if the bone is well developed or blunt and if the cartilage is broad, narrow, or narrower on ultrasound. now the US scans are being repeated 3 times during treatment.
which statistical test can I utilize to statistically analyze improvement with time with ordinal data?
also when 3 observers are doing the measurements, does one pick one of the observations to calculate averages, SD, and use a t-test, etc?
Thank you very much for your help!
You state that the scans are repeated 3 times during treatment. Do these represent three time periods, namely the time periods over which you are looking to test whether there is improvement?
Regarding the observers, you have a few choices, e.g.: (1) treat these as a second factor. In this case, you have two repeated measures factors (Time and Observer). (2) take the average of the measurements by the 3 observers.
With 3 time periods, in either case, you can use the appropriate repeated measures ANOVA.
Charles
Actually, the situation may be a little more complicated since you are measuring two things: bone development and cartilage shape. If there is an interaction between them, then you may need to use MANOVA instead of ANOVA.
Also, when you say that you have ordinal data, do you just mean 0 (bone is blunt) or 1 (bone well developed)? And 0 (narrower), 1 (narrow), or 2 (broad)?
I assume that you are measuring several bones (from different individuals). How many bones are you analyzing?
Charles
For some reason, I was not able to reply to your last comment.
The development of bony structure and cartilage thickness are inversely proportional. as the bone develops more, I expect to see the narrowing of the cartilage. so it would be rated as 0 (blunt bone), 1 (Well developed bone) and 0 (Broad cartilage), 1 (Narrow cartilage), 2 (Narrower cartilage).
I have not rated them as of now, but I guess I should, to do any statistical test.
I am measuring just the acetabular socket in over 123 individuals to document any improvement in time with treatment. Will MANOVA be the right test?
Many thanks
Bhushan
MANOVA would be the correct test if the data were normally distributed, but with only 2 or 3 values, normality is not likely. In such cases, a non-parametric test is more appropriate (or even bootstrapping).
Let’s keep things simple for a minute. In the case with two values 0 (blunt bone) and 1 (well-developed bone) and two time periods, you can perform the Wilcoxon signed ranks test or even a signed test. This would also work for 3 values 0, 1, and 2. If you add another time period (and you care about comparing all of the time periods) then Friedman’s test would be appropriate.
Charles
Hi.
I Would it be correct to use the weighted Cohen’s kappa to establish if the observers agree (or the degree of disagreement) in following example: Two different optometrists have examined the same 37 patients using streak retinoscopy under the same conditions but blinded so the two observers do not know the findings the other observer made. This is to establish if the patient is near-sighted (negative diopters), emmetropic (0-diopters) or far-sighted (positive diopters). Each examiner notes with a precision of 0.5 diopters. Is this the correct test to use then or would you suggest another? Thanks in advance!
Hello Soren,
Cohen’s Kappa is good if the ratings are categorical. If I understand correctly, it seems that there is an order to the ratings and so they are not categorical. If this observation is correct and you can capture the order via the weights, then Weighted Cohen’s kappa is an acceptable approach.
Other options are Krippendorff’s alpha and Gwet’s AC2.
Charles
I have 2 raters randomly chosen from a pool of 12
Each rates the procedure outcome with a score from a series of 100
I want to assess the inter-rather reliability of the assessment tool
The score is ordinal in order from 1 to 10
I think a weighted Kappa may be appropriate due to the number of potential outcomes but I’m not sure about having a variety of raters?
Hey Charles, I have two raters, each giving a score of 1-12 for several tasks. I need to know how similar/different the two raters’ scores are, and if the difference between their scores is statistically significant.
Is this a scenario weighted Kappa would work in? Here’s an example of the data I’m talking about:
https://docs.google.com/spreadsheets/d/1xscQ170UDmbKKG5IoANEHRM_RDX561Gqe46EkoIaKoQ/edit?usp=sharing
Tarek,
Yes, you can use weighted kappa for this. You will need to calculate a separate kappa for each task.
I am not sure what the cases refer to. If these are repeated ratings by the same rater, then weighed kappa may not be the right approach unless you take the mean of the cases.
Charles
Is the assumption that the two raters are unique an abolute requirement? What if there is always a randomly selected rater from a pool of raters? Each subject rated by two raters.
Marthe,
In this case, I believe that you should use Fleiss’s Kappa.
Charles
Charles, I am using kappa statistic to compared patient and family member responses to the same question (about the patient). For ordered variables I had thought to use a weighted kappa statistic. Should I also report weighted percent agreement, I ask because I am having a hard time getting my head around how one would interpret this (vs. regular percent agreement)
Ann,
How do you define “weighted percent agreement”?
Charles
Hi Charles,
Thanks for all the material in the website!
Two questions:
(1) What is the reference for the equation used to calculate the weighted kappa standard error?
(2) Is it possible to have upper limit of the 95% confidence interval above 1? The reason for the question is because kappa value ranged from -1 to 1.
Best,
Hello Thiago,
(1) I can’t recall now, but I believe I used the same formula that NCSS uses
(2) No. The upper limit is 1.
Charles
Hi, I am calculating inter rater reliability across 2 teams for a series of interviews. There are many possible codes (30), which are not ordinal. The coders were able to select multiple codes for the same response and often did. I’m looking to see inter rater reliability but the high number of possible codes is a challenge for reliability. I am wondering whether I am best to measure reliability using a weighted or unweighted kappa, I’m unsure what the best method would be or if there is even a clear rule as to what to select in which situation. Thank you!
Hi Jess,
Let me see whether I understand the scenario that you are trying to address. Is this the scenario and if not, please provide additional explanation.
1. There are two raters (the two teams)
2. Are there 30 subjects (the 30 possible codes) each of which is assigned a value 1 (selected) or 0 (not selected)?
Charles
Hola, tengo dos observadores y dos categorías (positivo-negativo) para cada observador.
Hice un indice de kappa que salio bueno, pero me sugirieron hacer una comparación mas especifica de mis resultados. por ello el kappa ponderado es mejor. solo tengo una duda como saber que pesos debo de colocarlos.
This depends on why you need to use Weighted Kappa. There is no simple answer to this question.
Charles
Por qué me sugirieron que realice una comparación estadística mas precisa para la comparación de los métodos que emplee. Gracias Charles.
Sorry, but I don’t have anything more to add from what I said in my previous response.
Charles
Hi there,
I am wondering what the best way to calculate the required sample size for a weighted kappa statistic is? I will have multiple raters completing an ordinal 6 point scale (equal weights between each point), and I would like to know how many raters I need.
As well, each one of my raters responses will be compared to the response of a tool that we are testing the validity of (i.e. a gold standard response). Can all of the raters responses be combined, or should I calculate the weighed K of each individual rater vs the tool, and then do some sort of mean weighted kappa?
Thanks for your help!
Hello Christine,
1. I expect to add the subject of sample size requirements for Cohen’s kappa to the next release of the Real Statistics software, due out this month
2. Keep in mind that weighted kappa only supports two raters, not multiple raters.
3. You can clearly combine separate kappa measurements in many ways (mean, median, min, etc.), but what would the purpose of such a measurement?
Charles
Thank you for your response! I look forward to the sample size requirements being released soon!
For the weighted kappa, I will be having multiple participants in my study rate items on the 6-point ordinal scale, and I want to compare each of their ratings to how our tool (i.e. a gold standard) rates the same items on that 6-point scale. We are using this study to validate the tool. What I am after is an “overall weighted Kappa” of the agreement between ALL the raters, and the tool.
Christine,
Weighted Cohen’s kappa can only be used when you have two raters (or one vs a gold standard). You can’t use it for more than two raters.
You can use a number of tools (Fleiss’s Kappa, Gwet’s AC2, etc.) when you have more than two raters. These are covered on the Real Statistics website.
Now, you have to decide what you mean by agreement when you have more than one rater against a gold standard. The case where all of the raters agree with the gold standard is easy, but what if the raters all agree but they don’t agree with the gold standard; in this case is the measurement high or low? What if one of the raters agrees with the gold standard but the others don’t?
Charles
Would it make sense to do a mean weighted kappa of all of the instances of a rater vs gold-standard comparison?
What i really want to know, is on average, how well do raters agree with the gold-standard.
thanks again for all your help.
Christine,
Yes, you calculate a weighted kappa for each rater and then take the average of the kappas.
Charles
If I want to determine the inter-rater reliability for two raters on a (6 point) ordinal scale, what is the best method to do so?
Thank you!!
Hello Elyne,
You can use Weighted Cohen’s, ICC, Krippendorf’s alpha or Gwet’s AC2. Which to use probably depends on which approach is most accepted in your field of study. I would tend to use Gwet’s AC2 or Weighted Cohen’s. All these approaches are described on this website.
Charles
Thank you Charles!
What sample size would I need for the Weighted Cohen’s Kappa?
Hello Elyne,
I expect to add the subject of sample size requirements for Cohen’s kappa to the next release of the Real Statistics software, due out this month.
Charles
Hello,
I was wondering what I would do if I had three raters rating samples on an ordinal scale (0-3), with zero being none and 4 being severe. I understand that with two raters, I would use weighted kappa, which takes into account that a discrepency between zero and one is less severe than one beteween zero and four. How would I apply the principals of a weighted kappa to three raters?
Thanks for your help!
Dana
Hello Dana,
You can use Gwet’s AC2 or Krippendorff’s Alpha. Both are described on the Real Statistics website.
Charles
Hello Charles,
I would like to ask if i have 2 raters that need to evaluate 3 tasks done by 5 subjects, should i measure weighted kappa for every tasks to report the inter rater reliability or is there any way to compute the results?
Hello Hani,
It depends on why you are trying to measure agreement, but the easiest and most straightforward way would be to report three separate measurements, one for each task.
Charles
Charles, I would like your opinion on analyzing the data in a sample.
I have a bank where 12 injuries were classified with an instrument containing 3 possible categories. In all, 84 observations / classifications were obtained, however each lesion was classified by the number of people available at the time of data collection. In other words, there are lesions classified by 3 people and lesions classified by 10.
A specialist in the treatment of wounds was used as gold standard to classify the injury and to allow the existence of a template.
Could I evaluate the agreement of this sample using Fleiss Kappa or Weighted Cohen’s Kappa?
Cinthia,
For Weighted Cohen’s Kappa you must have exactly two raters. For Fleiss’ Kappa each lesion must be classified by the same number of raters. Thus, neither of these approaches seems appropriate.
I suggest that you look into using Krippendorff’s or Gwen’s approach. Both of these are described on the Real Statistics website.
Charles
Thank you very much for the help Charles, it was extremely enlightening! Congratulations on the work on the site, it is very useful for those who do not have as much knowledge in statistics!
Hi Charles,
I need your support in the following issue. I have 15 Raters, who all rated the same 10 pictures to a five-point ordinal rating scale. This was done in two separated time-points. How can I calculate the agreement of the raters between the two time-points?
Thanks in advance for your help,
Marius
Marius,
If I understand correctly, you don’t care about agreement between the raters, but only whether each rater doesn’t change his/her rating much between the two time periods. I don’t know of any standard measures of agreement in such a case.
Charles
Hi,
Congratulations and thank you for a terrific program! I have a practical question. Is it possible to use data that are arranged in columns as input? Eg Excel Column A has 30 observations (5-point Likert scale) of Reader A and column B has 30 observations of Reader B. From the example above I understand that the data need to be first rearranged into a cross-table format? But, is it possible to use the columns directly as input without having to tabulate a cross-table (as it seems possible for the “T Test and Non-parametric Equivalents)?
Thaks you,
Jan
Jan,
If you are referring to Weighted Kappa, you need an m x n contingency table. What are the values of m and n for your example? m = n = 30?
Charles
Hi,
Sorry, I missed you posted, I thought I would get an email.
I have two columns (observer A and observer B) with 30 paired observations (0,1,2,3,4, or 5 for each observation – ordinal data). I need to calculate the observer agreement and want to use weighted Cohen’s kappa.
I understand now that this format needs to be translated first into an m x n contingency table. I managed to do this with excel. However, it would be terrific if this could be done straight from the two columns. I was under the impression this function is not available in real-statistics, or did I overlook it?
Jan,
From your response, I understand that you need a 6 x 6 contingency table (rows and columns contain the headings 0,1,2,3,4,5).
Assuming that your 30 paired observations are in the range A1:B30, use the Chi-square Test for Independence data analysis tool with Input Range A1:B30 and select the Standard format option. The output will contain the desired 6 x 6 contingency table. You can ignore the rest of the output.
Now you can use this 6 x 6 contingency table as the input to the Weighted Cohen’s Kappa data analysis tool.
Charles
Thank you!
Jan
Hi Charles,
Thanks for your page!
I would appreciate your opinion on what to do when for an item, (scored ‘1’=not completed, ‘2’=partially completed, and ‘3’=completed), one assessor has rated ‘3’ for all 32 of their scorings of the item – therefore SPSS will not calculate CWK, as there is a ‘constant’. There is also only 1 discrepancy in these 32 pairs of scorings (rated ‘3’ by Assessor 1 and ‘1’ by Assessor 2, on calibration rated ‘1’).
There is another case of this situation for another item, (all scorings ‘3’ by Assessor 1, the only discrepancy rated as ‘3’ by Assessor 1 and ‘2’ by Assessor 2, calibrated as ‘2’).
Do you have any recommendations of what I could do to analyse these instead?
Best wishes,
Shaira
Hi Charles,
I am using Cohen’s Weighted Kappa for my research and I have a few questions.
First, it is still meaningful to interpret the Kappa value if it is not significant?
Second, if I have repeated measures and I would like to calculate a Kappa value for each measure and then take the average of all the Kappa values, how can I calculate the overall P value? (I prefer to calculate a Kappa value for each measure because they were not exactly “repeated measures”. In fact, the total number of instances for each measure varies.)
Thank you so much! Looking forward to your insights!
Xuan,
If Cohen’s weighted kappa is not significant, then you can interpret it as near zero, which is generally viewed as a lack of interrater agreement.
I don’t know know how to aggregate multiple kappa’s. I am not sure whether taking the average makes any sense.
Charles
Thanks!
Hello Charles,
Need your opinion on the followng topic. We would like to gage the interrater reliability and rater reliability versus reference of a procedure. We produce parts thats visually evaluated as ok/not ok based on how it looks (texture for example) by raters. We are required to use Choen’s Kappa for this but there is a problem. As far as I know Cohen’s Kappa compensates for chance agreement based on the assumption that when a rater is unsure about the value of the part, he/she takes a random guess. Our raters are trained to reject a part (value=not ok) if they are unsure so that a bad part will not find it’s way to the customer. This goes against the Cohen Kappa’s base premise in my opinion, and the calculated values wont reflect the actual reliability of our raters. Do you think Cohen’s Kappa can still be used under these circumstances or is there another test thats more appropriate for this setting?
Thanks in advance for your help!
Best wishes,
Tom
Tom,
Cohen’s kappa does compensate for chance agreement, but I don’t believe that is based on uncertainty of the rater(s).
There are other tests that you can use. E.g. Gwet’s AC1/AC2.
Charles
Thank you for the feedback.
In your opinion would it be a better system to measure rater agreement if we added an extra category, i.e.: “acceptable”, “not acceptable”, “unsure”? That way the Kappa wouldnt be skewed because of the rater’s training to reject a part when unsure. (The goal would be to see if the raters can recognize good and bad parts and to gauge how consistent they are with each other and themselves).
Tom
Tom,
The issue then is what weight to give to such a rating.
Charles
Hi Charles,
I would like to calculate test retest agreement per item for a 7 points likert scale measure (strongly agree to strongly do not agree).
How to weight each response?
Kate,
You have many choices for this, but one approach is to use C(|k-h|+1,2) as the weight where h and k are the the two Likert scale measurements.
If you treat the Likert scale as interval data, then you can use (h-k)^2 instead.
In the next release of the Real Statistics software I plan to introduce Gwet’s AC2 and Krippendorff’s alpha measurements of interrater reliability. These types of weights will be discussed on the website at that time. The new release should be available shortly.
Charles
Dear Charles,
Can you please share any idea about the following concerns:
I wanted to find the inter-rater reliability index with two raters of a math test grading scheme. I made codes, each of which considers both the score to be credited for the answer and the strategy used (e.g. code 21 means a score of 2 points, with strategy A used, code 22 means a score of 2 pts. with strategy B). With this grading scheme, I end up with a lot of categories (codes) to choose in rating student’s answer. But after comparison of codes, I noticed that more than half of these codes received 0 frequency from both raters (because students’ answers are almost similar).
Concern 1: Can I exclude those categories (codes) with 0 frequency from both raters in making the contingency table?
Concern 2: I would want to verify – is weighted Cohen’s Kappa suitable to use for my type of data?
Your response would be greatly appreciated. Thanks!
Cherel,
1. Yes, you can exclude categories with 0 frequency from both raters
2. Yes, you can use Cohen’s kappa if you can figure out what the suitable weightings are.
Charles
Hello Charles,
First of all, thank you for responding to my previous post.
Regarding your reply for concern 2, may I know any method to use to determine what weightings I should use? It’s unclear to me what’s the basis for choosing linear or quadratic weights.
Thank you for the help!
Cherel,
You can use weightings if there is order in the ratings. E.g. if your judges are assigning ratings of Gold, Silver or Bronze then perhaps you would assign a weight of 5 for Gold, 3 for Silver and 2 for Bronze.
Charles
Hello Charles,
I think I already got what weighting means. Thank you for clarifying it to me.
With the type of codes I have, I believe I should do unweighted Cohen’s kappa. However, is it possible that I will break my codes into two categories, i.e. score and strategy used, and then do a separate Cohen’s kappa computation for each? The codes for the strategy used will then be analyzed using Cohen’s kappa, while the scores will be analyzed with linear weighted Cohen’s kappa. Am I thinking it right?
Thanks!
Cherel,
This sounds like a reasonable approach.I can’t say whether it does what you need, since I don’t know this, but it certainly could be a good approach.
Charles
Dear Charles
I am interested to calculate kappa squared in mediation analysis. Could you please guide me for the calculation in excel?
Bahaman,
The Real Statistics webpage https://real-statistics.com/reliability/cohens-kappa/ describes Cohen’s kappa.
If instead you are looking for Cohen’s kappa squared as an effect size for mediation analysis, please see the following:
http://lib.ugent.be/fulltxt/RUG01/002/214/023/RUG01-002214023_2015_0001_AC.pdf
http://quantpsy.org/pubs/preacher_kelley_2011.pdf
http://etd.library.vanderbilt.edu/available/etd-05182015-161658/unrestricted/Lachowicz_Thesis_20150526.pdf
Charles
I cannot perform the control+m in excel to know the std. error and confidence interval. Is there any way to compute the standard error and confidence interval using excel? thank you.
Iza,
You need to install the Real Statistics software to use the control+m features.
The referenced webpage explains how to calculate the standard error and confidence interval in Excel (without using the Real Statistics software), but it is not so easy to do.
Charles
Thank you for your helpful information 🙂
I calculated the formula for weighted kappa, and I wonder at what level of significance (p value) this kappa coefficient is statistically significant.
Heemin,
As usual, alpha = .05 is used to measure statistical significance. Remember though that significance means significantly different from zero.
Charles
Hello, Charles.
First of all, thank you for your quick reply! 🙂
I have some questions on what you wrote above.
Does alpha = .05 means p value, right?
Then how I can figure out my Kappa coefficient values are under the significance level of .05?
Are alpha and p value different?
To elaborate my questions, I obtained weighted kappa coefficient values with using the formula you wrote above. However, I cannot sure this values are at significance level. When I use SPSS for calculating unweighted kappa, the p values are presented on the table. With this level, I can reject the null hypothesis and the two variables I used were agreed at the degree of obtained value. However, using EXCEL I’m not sure whether my obtained weighted kappa values is statistically significant or not. I hope my questions are clear to you ;'(
Thanks!
See the webpage referred to in my previous response.
Charles
Heemin,
alpha is the goal and the p-value is the actual value calculated. Seethe following for a further explanation:
Null and Alternative Hypotheses
Charles
Hello Charles,
I would like to evaluate the agreement of 2 rates rating surgical performance. The rating is from 1 to 5, 1 being the poorest and 5 being the best. Can I use weighted kappa? How can I that in SPSS? If I have 3 raters, can I still use weighted kappa?Thank you!
Jian,
With two raters, it seems like a fit for weighted kappa. I don’t use SPSS and so I can’t comment on how to do this in SPSS.
With three raters, you can’t use the usual weighted kappa.
Charles
Hi Charles,
Thank you for your reply. I really want to learn how to do weighted Kappa on excel, but I cannot understand the tutorial above. Is it possible for me to face time with you so you can help me with this? Thank you
Hi Jian,
Sorry but I don’t have enough time to do this sort of thing. I am happy to answer specific questions though.
What don’t you understand from the tutorial?
Charles
Thank you for the ever useful and interesting explanations you provide.
If we have 2 raters who were asked to rate results according to mild, moderate, severe scale. Let us assume that all the assumptions are met and this is a straightforward weighted kappa analysis.
I understand that the agreement between these 2 raters can be calculated using weighted kappa, but is it possible to show the rate of agreement between the raters AT EACH LEVEL of the grading scale?
for example, can we find out if the agreement was higher when the ratings were mild compared to other grades?
Hamid,
Before I can answer your question, I need to understand what you mean by “can we find out if the agreement was higher when the ratings were mild compared to other grades?” Obviously if both raters rated mild they are in complete agreement. Perhaps you mean what “can we find out if the agreement was higher when one rater gives a mild rating compared to the level of agreement when one rater gives a moderate or severe rating?” If this is what you mean, then you need to define how to measure the level of agreement when one rater assigns a mild rating. What sort of measurement seems appropriate?
Charles
dear
thanks for your helpful website.
I am wondering if I can use fleiss kappa for 5 points -likert scale (Strongly disagree, disagree, neither , agree, strongly agree) instead of weighted kappa. because we are looking for agreement between 10 raters (testing the content validity). and in our research we do not concern about the weight.
Enas
Hi Charles,
I have some categorical/ nominal data. The categories are “Certain”, “Probable”, “Possible”, “Unlikely” and “Unassessable”. There is no order to these. I have been advised to use weighted quadratic kappa by a statistician however I am slightly unsure as to how this would apply for my data. Would it be better to use linear weighted kappa?
Thanks
Hanna
Hanna,
I can certainly see an order “Certain” > “Probable” > “Possible” > “Unlikely” > “Unassessable”, although I am not sure about the last of these categories. Since there is an order you could use weighted kappa.
Charles
Hi Charles, I’m a nu-bee in SPSS. Is it possible to do the whole thing in SPSS? Like calculation of weighted kappa, drawing the table etc.? If so what would be the command? How to determine quadratic weights for weighted kappa?
Sorry Arthur, but I don-t use SPSS.
Charles
Hi Charles,
Thank you for the useful guidance here.
I have two questions.
First, if someone calculates unweighted Cohen’s K when actually their data are ordinal so it would be more appropriate for them to calculate weighted Cohen’s K, would the result be a more or less conservative estimate of reliability?
Second, I have some categorical data, with 4 categories. Three of these are ordered, e.g., low, medium, high, but one of them is a sort of “other” category and so not really ordered. Would you classify this variable as ordinal or nominal?
I have chosen to classify it as nominal, and therefore, have calculated unweighted Cohen’s K, yielding a significant k value of .509 (hence my first question on interpretation).
Thanks so much.
Amber
Amber:
1. I don’t have any reason to believe that it would be a conservative estimate. It would be a different estimate. Better to use the value for the weighted kappa.
2. I guess it depends on what “other” really means. If it means “I don’t know”, you might be better off dropping those values and treating the variable as ordinal, especially if only a small percentage of the respondents answer “other”.
Charles
thanks to anyone will answer
I have a table 2 x 2 with this data:
16 0
4 0
With a calculator i get k= 0 with CI : from 0 to 0
it looks so strange, is it correct?
Edward,
Sorry, but I don’t understand the point of analyzing such lopsided data.
Charles
Hi Charles,
I’m a very beginner and inexpert. I have to apply the cohen’s kappa to some table 2 x 2 showing the adhesion to a specific protocol. For example for the data in the table
53 1
1 5
I get a kappa of +0,815 with CI: 0,565 to 1000
But with the data
16 0
4 0
i get k=0 with CI: 0 to 0
I mechanically applied this calculater for my thesis, i’m really inxpert. You say these are lopsided data, therefore i can’t apply the cohen’s kappa?
Edward,
You can use Cohen’s kappa.
I get the same results for the first example.
For the second example, I get kappa = 0 with a CI of -.87 to +.87.
Charles
thank you so much Charles, you re very kind
Hi Charles,
thank you for this great explanation.
For a paper I calculated the Weighted K (wK). However I’m wondering how to interpret my wK…
Can I interpret my wK just like the unweighted K? So, for example, a wK greater than 0.61 corresponds to substantial agreement (as reported in https://www.stfm.org/fmhub/fm2005/May/Anthony360.pdf for the unweighted k)?
Thank you for your help!
Danile.
Daniele,
Yes, I would think that the interpretation of weighted kappa is similar to unweighted kappa. Keep in mind that not everyone agrees with the rankings shown in Table 2 of the referenced paper (nor any other scale of agreement).
Charles
Thanks for your reply!
Yes, I know that there isn’t an agreement about the rankings… I found several types of ranks for the kappa interpretation.
Can you suggest a reference of reliable (in your opinion) rankings?
My field is neuroimaging (medicine), so it is not supposed to be an “exact science”…
Best regards,
Daniele.
Daniele,
The different interpretations are all fairly similar. I can’t say that one is better than another.
Charles
Can this concept be extended to three raters (i.e., is there a weighted Fleiss kappa)?
Rose,
I don’t know of a weighted version of Fleiss kappa or a three rater version of weighted kappa. Perhaps ICC or Kendall’s W will will provide the required functionality for you.
Charles
Dear Charles,
Thank you for proving the overall information of kappa.
I’m reviewing a statistical analysis used in a reliability study and kappa is widely used in it. However, in many cases using ordinal scores, they just said that kappa was used in the study. I’m wondering if I could know whether they use weighted OR unweighted kappa in those papers without mentioning of the exact name. In addition, if they use the weighted kappa, can I distinguish the type of weighted kappa (linear or quadrtic) without mentioning if the statistical table shows K value only?
Regards,
Miran
Miran,
I don’t know how you could determine this. My guess (and this is only a guess) is that unless they said otherwise they used the unweighted kappa.
Charles
Dear Charles,
Thank you for your answer. I’ve judged that a paper used the unweighted kappa unless they mention about the weighted kappa so far.
Regards,
Miran
I am curious about the application of weighted kappa in the following scenario. I had two raters complete a diagnostic checklist with 12 different criteria. The response to each criteria was either 1 or 0 (present or absent). If a specific number of criteria were present, then an overall criteria was coded 1 (if not, 0). Are dichotomous responses considered ordered in this case? Is weighted kappa the appropriate statistic for reliability?
Chris,
Dichotomous responses are generally considered to be categorical, although depending on what the data represents they could be considered to be ordered. E.g. Male = 0 and Female = 1 is not really ordered, while 0 = Low and 1 = High could be considered ordered.
Regarding your specific case, I understand that if a rater finds that say 6 or more criteria are met then the score is 1, while if fewer than 6 are met then the rating is 0. This could qualify as ordered. Based on what you have described you might be able to use weighted kappa, but I would have to hear more about the scenario before I could give a definitive answer.
Note that the coding that I have described throws away a lot of the data. You might be better just counting the number of times the criteria are met and use this as the rating. Then you could use weighted kappa with this number as the weights. You might also be able to use the intra-correlation coefficient.
Charles
Hi Charles,
What is the best method of determining the correct predefined weight to use?
Cheers,
John
John,
You need to decide what weights to use based on your knowledge of the situation. The usual weights are linear and quadratic.
Charles
Hi Charles,
I would like to know what would be the minimum sample size for a reliability re-test of a newly developed questionnaire of 100 items, ordinal scale (1-5), considering 80% power (0.05 type I error) to detect an acceptable weighted Kappa coefficient ≥0.6 in a two-tail single group comparison. Could you please help me with that or provide me any good reference that contains this information?
Thank you for your help.
Deborah.
Deborah,
I found the following article on the Internet which may provide you with the information that you are looking for.
http://www.ime.usp.br/~abe/lista/pdfGSoh9GPIQN.pdf
Charles
Hi Charles,
Thank you so much for your help. I managed the sample size but now I have another problem. I am developing and evaluating the psychometric properties of a multidimensional psychological scale. One of the measurements is the reliability re-test, for which I handed out two copies of the same questionnaire for participants to complete each of them within an interval of 15 days. I need now to compare both results, for each participant, to see how much the outcomes have changed in between measurements. The scale has 100 items, each of them with 1-5 categorical responses (from never to always, for example). Because it is categorical, I have been advised to use weighted Kappa (0-1.0) for this calculation ans I need a single final kappa score. Do you have any idea about which software and how to calculate it? I haven’t found anything explaining the practical calculation in a software. Thank you!
Deborah,
The referenced webpage describes in detail how to calculate the weighted kappa.It also describes how to use the Real Statistics Weighted Kappa data analysis tool and KAPPA function.
Charles
I have a 25 items that are rated 0-4 (from Unable to Normal). How should I calculate the inter-rater reliability between two raters and intra-rater reliability between two sessions for each item? If this should be a weight Kappa, then how to calculate the 95% confidence interval in Excel? How to calculate a single final kappa score.
Rick,
I don’t completely understand your scenario. Are you measuring the 25 items twice (presumably based on different criteria). Are you trying to compare these two ways of measuring? You might be able to use Weighted Kappa. The referenced webpage shows how to calculate the 95% confidence interval in Excel. I don’t understand what you mean by calculating “single final kappa score”, since the usual weighted kappa gives such a final score.
Charles
Dear Charles,
How do you compute the 95% CI for weighted Kappa? Is there anything already in your excel tool?
Thanks in advance for your help
Best regards
Cédric
Cédric,
The calculation of the 95% CI for the unweighted version of Cohen’s kappa is described on the webpage Cohen’s Kappa.
Shortly I will add the calculation of the 95% CI for the weighted Kappa to the website. I also plan to add support for calculating confidence intervals for weighted kappa to the next release of the Real Statistics Resource Pack. This will be available in a few days.
Charles
Cédric,
I have now added support for s.e. and confidence intervals for Cohen kappa and weighted kappa to the latest release of the Real Statistics software, namely Release 3.8.
Charles
Dear Charles,
thank you for the add-on and all the good explanations!
I will have rather large kappa and weights tables (20 items and weights ranging from 0 to 3). Can I extend the tables according to my needs or do I have to expect problems?
Best,
Niels
Niels,
You should be able to extend the tables. Alternatively you can use the Real Statistics WKAPPA function or the weighted kappa option in the Real Statistics Reliability data analysis tool.
Charles
How would one calculate a standard error for the weighted kappa? and thus a p value.
Richard,
I haven’t implemented a standard error for the weighted kappa yet. I found the following article which may be useful for you:
http://www.itc.nl/~rossiter/teach/R/R_ac.pdf (see page 19).
Charles
Hi Charles,
What do you do if judges do not know ahead of time how many students are being interviewed. For example, judges are asked to identify off-road glances from a video and place them in 3 different categories. Judge1 may identify 10 glances, while Judge2 only 5. They may agree completely on those 5 identified by Judge 2, but do the other 5 non-identified glances count as disagreements then?
Susana,
One way to approach this situation could be to assign a 4th category, namely “non-identified glance”. It is then up to you to determine what weight you want to assign to category k x category 4 (for k = 1, 2, 3, 4).
Charles
Hello Charles,
in literature a Weighted Kappa >.60 is considered Good, but where is this based on? I cant find any article that invests this topic, so where does this .60 comes from?
greets
Rob
Rob,
There really isn’t clear-cut agreement about what is an acceptable level. I have seen .6 or .7, but I would treat all of these cautiously. The following paper goes into more detail about acceptable levels for kappa and other measures, including references in the literature.
http://www.bartlett.ucl.ac.uk/graduate/csh/attachments/indexing_reliability.pdf
Charles
Your table of weights is a symmetric matrix with zeros in the main diagonal (i.e. where there is agreement between the two judges) and positive values off the main diagonal. Elsewhere, for example here http://www.medcalc.org/manual/kappa.php and here http://www.icymas.org/mcic/repositorio/files/Conceptos%20de%20estadistica/Measurement%20of%20Observer%20Agreement.pdf the main diagonal has values of 1.
I figured it out. Instead of using w = 1-(i/(k-1)) you are using w = i/(k-1). k is the number of categories and i the difference in categories.
I checked the WKAPPA results of the example given in against a calculated example in the reference cited in my prior post (Kundel&Polansky) and it all works out.
The nice thing about the WKAPPA function is that you can use a subjective set of weights and you are not limited to linear and quadratic weighting. Thanks!
Klaus,
I used zeros on the main diagonal instead of ones since it seemed more intuitive to me. As you point out, both approaches are equivalent.
Charles