Basic Concepts
The Nemenyi test is the same as the Tukey HSD Test (see Unplanned Comparisons), except that we test the difference between group rank means. This is done by using the following standard error

where k = the number of groups and n = the total sample size where the group sizes are all equal. The statistic q has a studentized range q distribution (see Studentized Range Distribution). The critical values for this distribution are presented in the Studentized Range q Table based on the values of α, k (the number of groups), and df = ∞. If q > qcrit then the two means are significantly different. This test is equivalent to
![]()
Picking the largest pairwise difference in means allows us to control the familywise value of α for all possible pairwise contrasts. In fact, this test keeps the familywise α = .05 for the largest pairwise contrast and is conservative for all other comparisons.
The Nemenyi post-hoc test can also be used when the group sizes are different. In this case, it is similar to the Tukey-Kramer test following ANOVA. Here, we use the following version of the standard error:
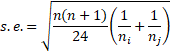
where ni and nj are the sizes of the groups being compared. When all the group sizes are the same, then this expression of the standard error is equivalent to the previous one. Also, note that the value inside the square root is equivalent to n(n+1)/12 divided by the harmonic mean of ni and nj.
Data Analysis Tool
Real Statistics Data Analysis Tool: The Single Factor Anova data analysis tool can be used to perform the Nemenyi test, as shown in Example 1.
Example 1: Conduct the Nemenyi Test for Example 1 of Kruskal-Wallis Test to determine which groups are significantly different.
The procedure is the same as for Example 1 of Kruskal-Wallis Test, except that this time the Nemenyi option is selected in the dialog box shown in Figure 1 of Single Factor Anova Analysis Tool. After clicking on the OK button the output shown in Figure 1 appears.
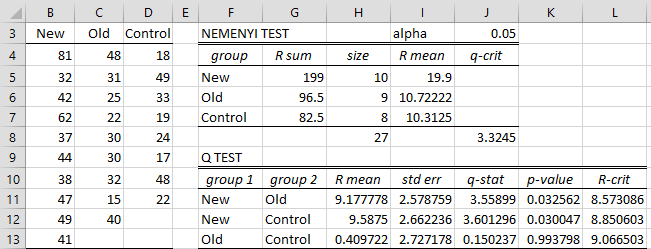
Figure 1– Nemenyi Test
First we note that the Kruskal-Wallis Test (cell Z17 of Figure 5 of Kruskal-Wallis Test) showed there is a significant difference between the three groups. We now use the Nemenyi test to determine which groups are significantly different.
Since p-value = .032562 < .05 = alpha, we conclude that groups New and Old are significantly different. The same conclusion is reached since q-stat = 3.55899 > 3.3245 = q-crit or R-mean = 9.177778 > 8.573086 = R-crit.
Similarly, New and Control are significantly different, while Old and Control are not significantly different.
Some key formulas from Figure 1 are shown in Figure 2.
| Cells | Item | Formula |
| G5 | R1 | =RANK_SUM(B4:D13,1,1) |
| H5 | n1 | =COUNT(B4:B13) |
| I5 | R1 mean | =G5/H5 |
| H8 | n | =SUM(H5:H7) |
| J8 | q-crit | =QCRIT(COUNT(H5:H7),480,J3,2) |
| H11 | mean diff | =ABS(I5-I6) |
| I11 | std err | =SQRT(H$8*(H$8+1)/12/HARMEAN(H5,H6)) |
| J11 | q-stat | =H11/I11 |
| K11 | p-value | =QDIST(J11,COUNT(H$5:H$7),480) |
| L11 | R-crit | =I11*J$8 |
Figure 2 – Selected formulas from Figure 1
Examples Workbook
Click here to download the Excel workbook with the examples described on this webpage.
References
NCSS (2018) One-way analysis of variance
https://www.ncss.com/wp-content/themes/ncss/pdf/Procedures/NCSS/One-Way_Analysis_of_Variance.pdf
Hollander, M., Wolfe, D. A. (1999) Nonparametric statistical methods, 2nd ed. Wiley