After a significant Kruskal-Wallis test, we can compare a control group with each of the other groups, in a manner similar to that used in Dunnett’s test after a one-way ANOVA. As for Dunnett’s test, Dunnett’s Table is employed. The group samples should be equal in size.
Data Analysis Tool
Real Statistics Data Analysis Tool: The Real Statistics Resource Pack provides a data analysis tool to perform Steel’s test, as shown in Example 1.
Example 1: Determine whether there is a significant difference between the Control and the New and Old groups for the data shown in range B18:D28 of Figure 1. Although not displayed, the Kruskal-Wallis test yielded a significant result with p-value = .0395.
To perform this test, we proceed as in Example 1 of the Nemenyi Test, except that we choose the Steel option instead of the Nemenyi option. When we press the OK button the result shown on the right side of Figure 1 is displayed.
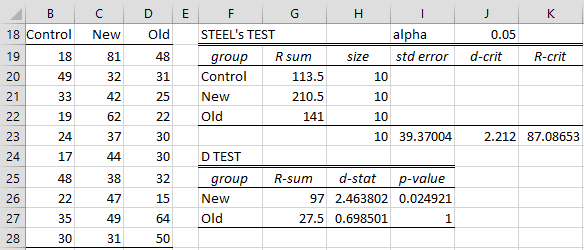
Figure 1 – Steel’s Test
Note that when using this option, the first group will be treated as the control group with which the other groups are compared.
Results
We see there is no significant difference between the Old and Control groups, while there is a significant difference between New and Control. Note that the p-value in cell I27 is estimated by the worksheet formula =DPROB(H27,COUNT(H$20:H$22),480) where H27 contains the formula =G26/I$23. The largest alpha value in Dunnett’s Table is α = .10, and so p-value = 1 simply means that the p-value is larger than .10.
Other formulas in Figure 1 include:
d-crit = DCRIT(COUNT(H20:H22),480,J18)
R-crit = I23*J23 and the formula for std error is
=SQRT(H23^2*COUNT(H$20:H$22)*(H23*COUNT(H20:H22)+1)/6)
Examples Workbook
Click here to download the Excel workbook with the examples described on this webpage.
References
NCSS (2018) One-way analysis of variance
https://www.ncss.com/wp-content/themes/ncss/pdf/Procedures/NCSS/One-Way_Analysis_of_Variance.pdf