Basic Concepts
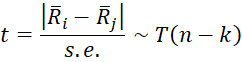
The Conover test uses the following test statistic where k = the number of groups, n = the total sample size, and ni and nj are the sizes of the groups being compared.
The standard error is
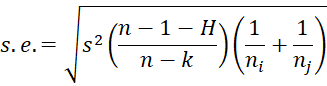
where H is the Kruskal-Wallis test statistic,
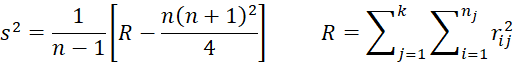
and rij is the rank of the ith element in the jth group.
We can alternatively use the ties corrected version H′ instead of H.
Property 1: If there are no ties, then
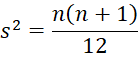
Proof: First note that
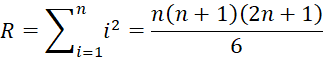
This last equality follows from the proof of Property 2 of the Wilcoxon Rank-Sum Test. Thus


Example
Example 1: Find all significant differences between the blemish creams of Example 1 of Kruskal-Wallis at the 95% significant level by using the Conover Test.
To perform this test, we proceed as in Example 1 of Nemenyi Test, except that we choose the Conover option instead of the Nemenyi option. When we press the OK button the result shown in Figure 1 is displayed.
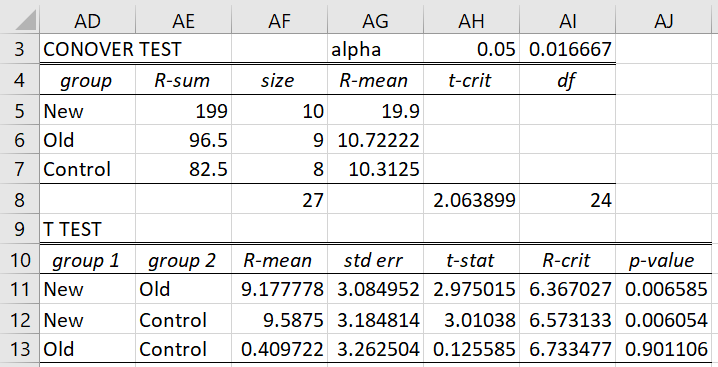
Figure 1 – Conover test
If we don’t use a familywise correction, then once again New-Old and New-Control are significant. If a Bonferroni correction is used, then these same comparisons are significant (e.g. p-value = 0.006585 < .016667 = corrected alpha for New-Old comparison).
The formulas are as for Dunn’s test with a few differences. E.g. t-crit = T.INV.2T(AH3,AI8) and df = AF8-COUNT(AF5:AF7). For New-Old, t-stat = AF11/AG11, R-crit = AG11*AH$8, p-value = T.DIST.2T(AH11,AI$8) and std err is calculated by the formula
=SQRT((SUMSQ(RANKS($B$4:$D$13,1))-AF$8/4*(AF$8+1)^2)/(AF$8-1)*(AF$8-1-KRUSKAL($B$4:$D$13))/(AF$8-COUNT(AF$5:AF$7))*(1/AF5+1/AF6))
Note that the formulas for t-crit and R-crit use the uncorrected alpha value in cell AH3. To use the corrected value, you only need to replace AH3 with AI3 in the formula for t-crit in cell AH8.
Examples Workbook
Click here to download the Excel workbook with the examples described on this webpage.
References
NCSS (2018) One-way analysis of variance
https://www.ncss.com/wp-content/themes/ncss/pdf/Procedures/NCSS/One-Way_Analysis_of_Variance.pdf