Introduction
On this webpage, we will focus on repeated measures ANOVA with two within-subjects factors and one between-subjects factor. We will assume that the sphericity assumption has been met and so won’t deal with correction factors. We also won’t explore follow-up testing, since we describe these extensively elsewhere (click here or here for more details).
Example
Example 1: Suppose there are three groups (G1, G2, G3), and each subject in these three groups was given 4 types of dexterity tests (T1, T2, T3, T4), each repeated once using the left hand and the other using the right hand. All the subjects in the experiment were right-handed. The data for this example are shown in Figure 1.
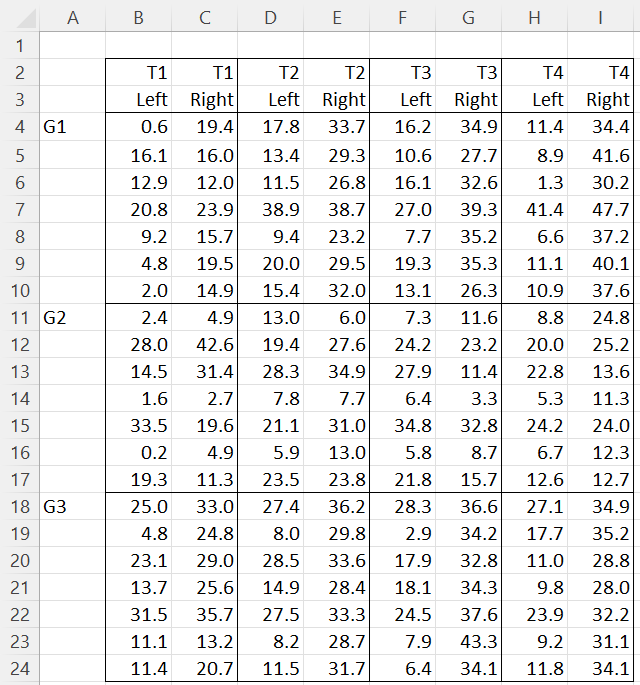
Figure 1 – Data for Repeated Measures ANOVA 2W+1B
The three groups make up the three levels of the between-subjects factor (Group), which we label A. The tests make up the 4 levels of a within-subjects factor (Test), which we label B. Finally, the two hands make up the levels of the other within-subjects factor (Hand), which we label C.
We use the scheme described in Figure 2. Here, a = # of Factor A levels, b = # of Factor B levels, c = # of Factor C levels, and m = # of subjects.
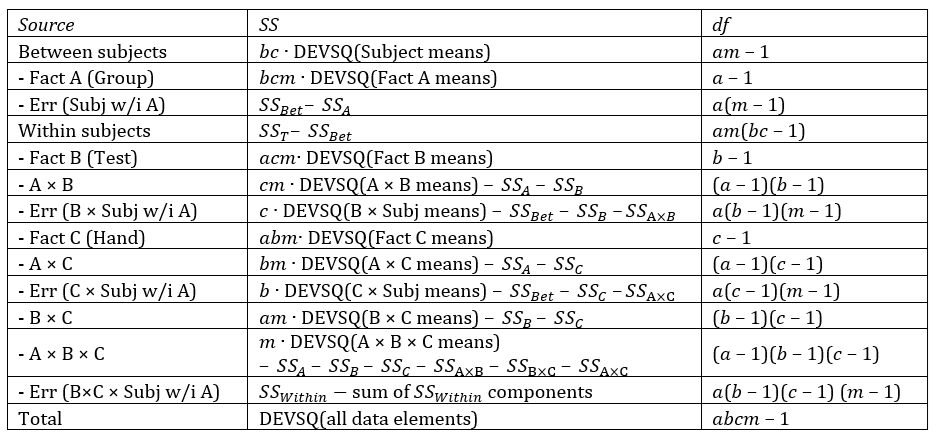
Figure 2 – Sources of Variation
Data Analysis Tool
Real Statistics Data Analysis Tool: The repeated measures ANOVA analysis required for one between-subjects factor and two within-subjects factors can be performed using Real Statistics’ Mixed Three-way Repeated Measures Anova data analysis tool.
For Example 1, press Ctrl-m and click on the Anova tab (or choose the ANOVA option if using the original user interface). Next, choose the Mixed Three-way Repeated Measures Anova option. Fill in the dialog box that appears as shown in Figure 3.

Figure 3 – Mixed Three-way Repeated Measures Anova dialog box
After pressing the OK button, the output shown in Figures 4, 5, and 6 is displayed.

Figure 4 – Repeated Measures ANOVA output (part 1)
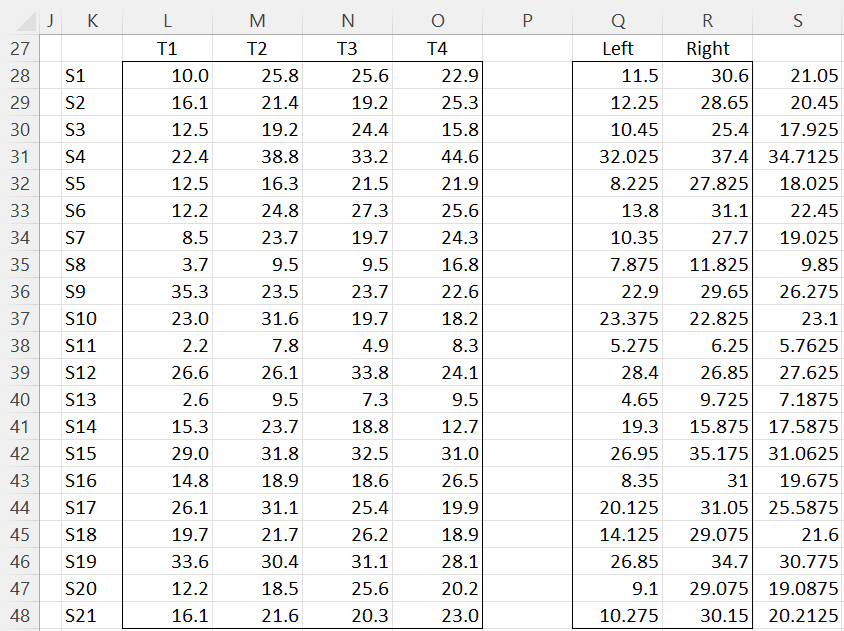
Figure 5 – Repeated Measures ANOVA output (part 2)
The core ANOVA analysis is shown in Figure 6.
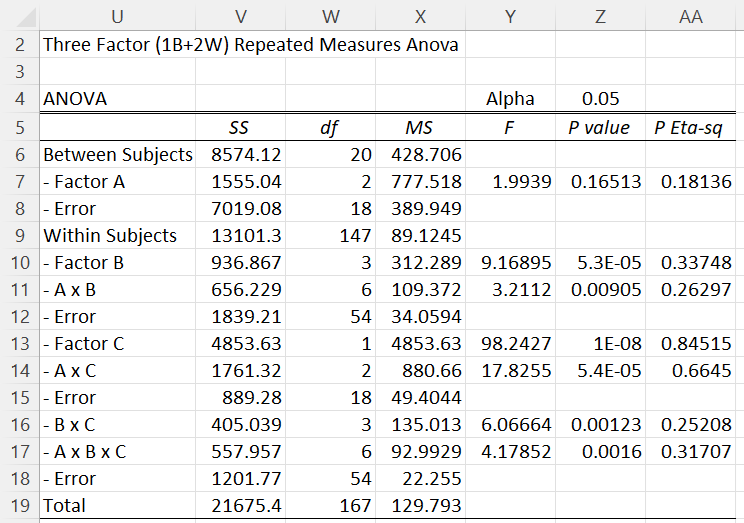
Figure 6 – Repeated Measures ANOVA output (part 3)
Representative Formulas
Representative formulas from Figures 4 and 5 are shown in Figure 7.
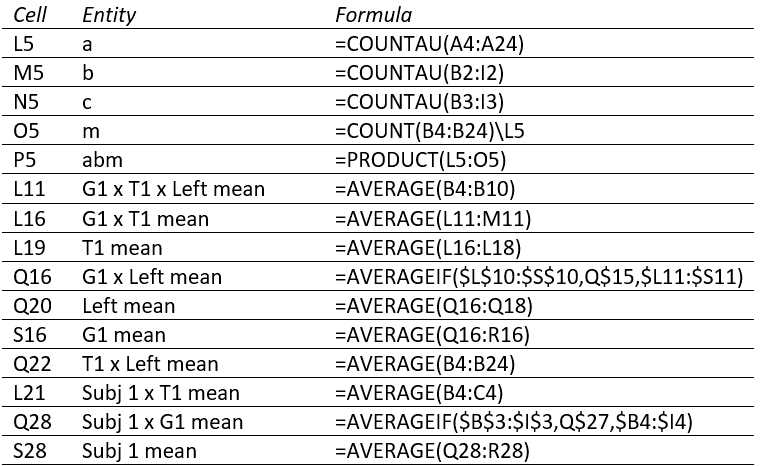
Figure 7 – Formulas from Figures 4 and 5
In addition, representative formulas from Figure 6 about degrees of freedom are shown in Figure 8, while those about SS are shown in Figure 9.
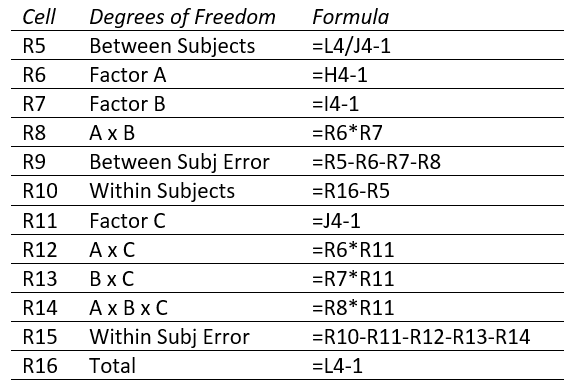
Figure 8 – Df formulas from Figure 6
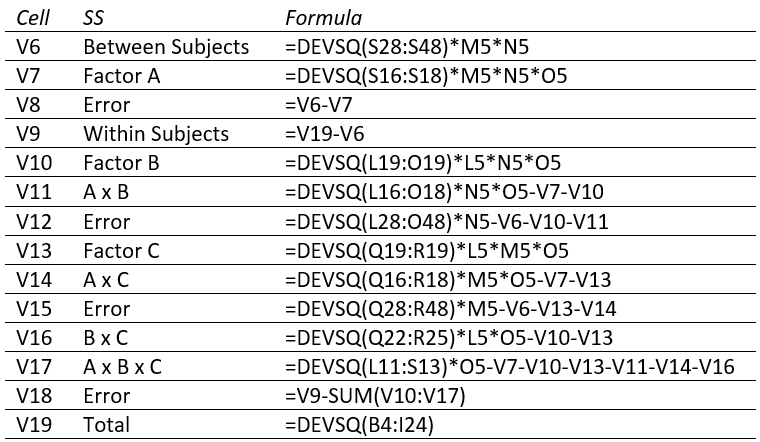
Figure 9 – SS formulas from Figure 6
Links
↑ ANOVA with repeated measures
Examples Workbook
Click here to download the Excel workbook with the examples described on this webpage.
References
Howell, D. C. (2010) Statistical methods for psychology (7th ed.). Wadsworth, Cengage Learning.
https://labs.la.utexas.edu/gilden/files/2016/05/Statistics-Text.pdf
Winer, B. J. (1962) Statistical principles in experimental design. McGraw-Hill
https://psycnet.apa.org/record/2008-16855-000
Dear Charles,
Thank you for your great statistics toolbox!
Can I use the Mixed Three-way Repeated Measures Anova with different number of subjects in the groups?
Thank you,
Albert
Hi Albert,
1. Glad that you like the Real Statistics toolbox.
2. The existing Three-way Repeated Measures Anova data analysis tool requires that each of the groups contains the same number of subjects. To handle the situation where the groups have a different number of subjects requires a regression approach along the lines described in the following webpage for two-way repeated measures ANOVA.
https://real-statistics.com/anova-repeated-measures/repeated-measures-anova-using-regression/mixed-repeated-measures-anova-using-regression/
3. Depending on your data, especially if the sample sizes are not too different, you can probably get by with using the existing tool, but you would likely need to make some modifications. E.g. if the number of subjects in one group is 10 and the other is 11, you could randomly delete one subject from the larger group. A refinement would be to run 11 separate versions of the existing tool. In each run you would remove a different one of the 11 subjects. You would then need to average the results in some way. Another approach is to duplicate one of the subjects in the smaller group and run the data analysis tool. This step is probably required to get the software to run at all. You would then need to remove the presence of the duplicate row of data from all of the calculations somehow.
I don’t know whether these approaches would result in valid results, but these could be good enough.
Charles
Hello,
I am curious of how you interpret the results of the output for the test presented? I understand the rows with a P-value lower than the alpha would equate to statistically significant, but what would be the data you include in the post-hoc, for say a post-hoc analysis on Factor C?
Thanks!
Hello Carsun,
You would compare Right hand vs Left hand across all the data elements.
Charles
Dear Charles,
I appreciate you taking the time to reply, and I apologize for the broken link. The amended version, which I hope will work: https://onlinelibrary.wiley.com/doi/10.1002/1521-4036%28200010%2942%3A6%3C663%3A%3AAID-BIMJ663%3E3.0.CO%3B2-7
https://onlinelibrary.wiley.com/doi/epdf/10.1002/1521-4036%28200010%2942%3A6%3C663%3A%3AAID-BIMJ663%3E3.0.CO%3B2-7
Currently, the test is compiled within the R package, so you may find it interesting to check out: https://cran.r-project.org/web/packages/nparLD/nparLD.pdf
Should the links not work, then I can email you the papers.
Best regards,
Magdy
Hello Magdy,
Yes, it would help if you could email me the papers.
Charles
Hi Charles,
I really appreciate this valuable website. Using a random group of 30 calves, we conducted an experiment in which the effects of three drugs on behavioral pain scores were tested. The measurements were performed before giving any treatments (baseline) and at intervals thereafter. We are interested to statistically test the differences between the groups/treatments (treatment effect), within each treatment in relation to the baseline (time effect), as well as the mixed effect of time and treatment. Is there any non-parametric test that can be performed since these variables are non-normally distributed? A Brunner-Langer longitudinal data model was used elsewhere to analyze similar data elsewhere (https://onlinelibrary.wiley.com/doi/10.1002/1521-4036(200010)42:6%3C663::AID-BIMJ663%3E3.0.CO;2-7). Can it also be used here, and would it be part of the real statistics add-in package?
Thank you!
Magdy
Hello Magdy,
This is an interesting topic, but currently, Real Statistics doesn’t provide support for the Brunner-Langer longitudinal data model.
I tried clicking on the link you provided, but I get an error message.
I see that Brunner and Langer have a book, but, not surprisingly, I was unable to download the book.
Charles