Introduction
On this webpage, we will focus on repeated measures ANOVA with two between-subjects factors and one within-subjects factor. We will assume that the sphericity assumption has been met and so won’t deal with correction factors. We also won’t explore follow-up testing, since we describe these extensively elsewhere (click here or here for more details).
Example
Example 1: We consider the situation similar to that in Example 1 of One Between and One Within Subjects Factor. This time, though, there are two between-subjects factors, Age (Young and Old) and Gender (Male and Female), and one between-subjects factor, Time (Day1, Day2, Day3, and Day4), based on the data in Figure 1.
Note that the data in range A1:F41 is reformatted in the figure for ease of display.

Figure 1 – Data for Repeated Measures ANOVA 1W+2B
We use the scheme described in Figure 2. Here, a = # of Factor A levels, b = # of Factor B levels, c = # of Factor C (within-subjects, i.e. repeated measures factor), and m = # of subjects.

Figure 2 – Sources of Variation
Data Analysis Tool
Real Statistics Data Analysis Tool: The repeated measures ANOVA required for two between-subjects factors and one within-subjects factor can be performed using Real Statistics’ Mixed Three-way Repeated Measures Anova data analysis tool.
For Example 1, press Ctrl-m and click on the Anova tab (or choose the ANOVA option if using the original user interface). Next, choose the Mixed Three-way Repeated Measures Anova option. Fill in the dialog box that appears as shown in Figure 3.
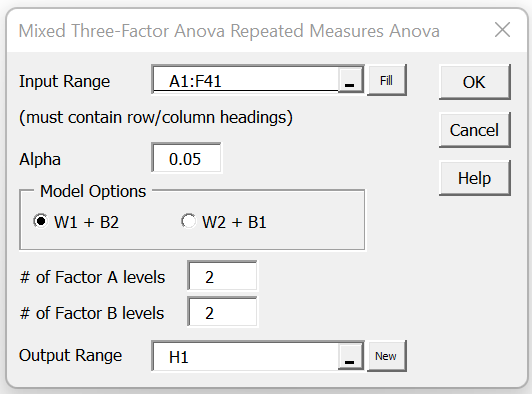
Figure 3 – Mixed Three-way Repeated Measures Anova dialog box
After pressing the OK button, the output shown in Figures 4 and 5 is displayed.

Figure 4 – Repeated Measures ANOVA output (part 1)
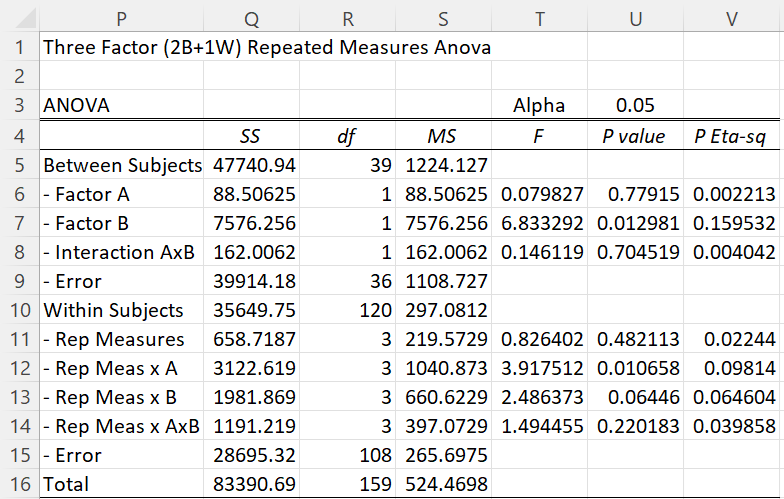
Figure 5 – Repeated Measures ANOVA output (part 2)
Representative Formulas
Representative formulas from Figure 4 are shown in Figure 6.
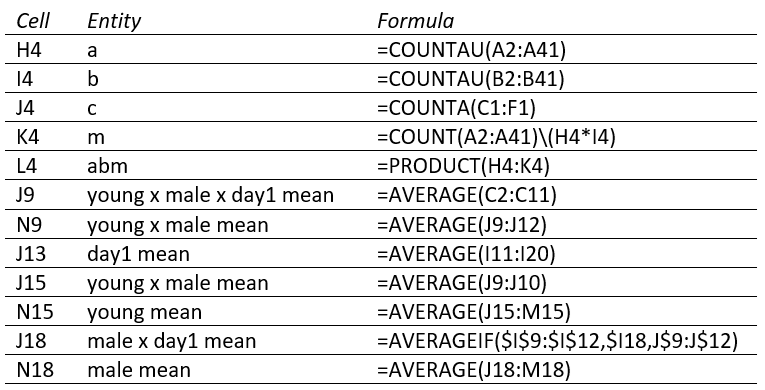
Figure 6 – Formulas from Figure 4
Representative formulas from Figure 5 about degrees of freedom are shown in Figure 7, while those about SS are shown in Figure 8.
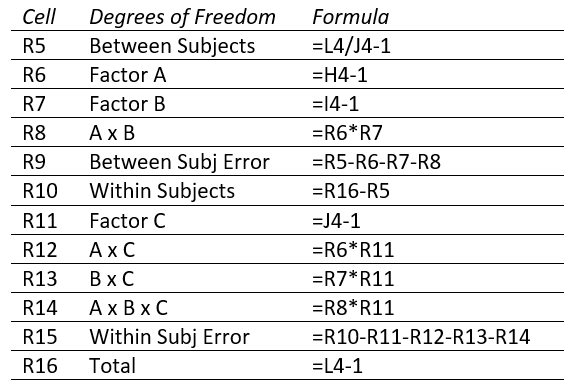
Figure 7 – Df formulas from Figure 5
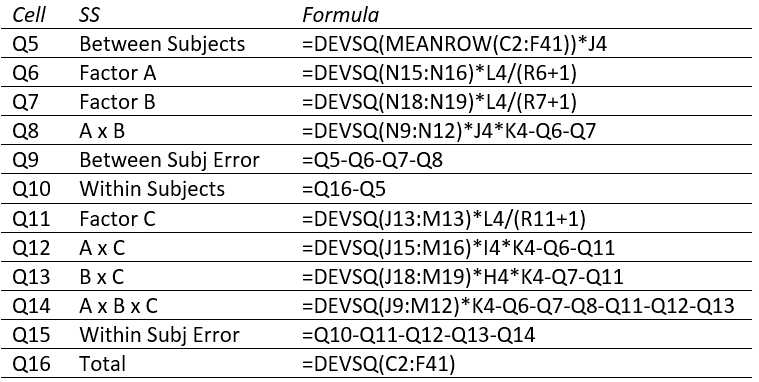
Figure 8 – SS formulas from Figure 5
Links
↑ ANOVA with repeated measures
Examples Workbook
Click here to download the Excel workbook with the examples described on this webpage.
References
Howell, D. C. (2010) Statistical methods for psychology (7th ed.). Wadsworth, Cengage Learning.
https://labs.la.utexas.edu/gilden/files/2016/05/Statistics-Text.pdf
Winer, B. J. (1962) Statistical principles in experimental design. McGraw-Hill
https://psycnet.apa.org/record/2008-16855-000
Good morning, this is only applicable for without replication right? If my data has 3 replications, what should I do? Should I just use the average of the three?
Hello Henry,
The example given on the webpage shows replications.
Can you provide some additional information about your scenario so we can determine whether this tool is appropriatee?
Charles
Hello Charles,
How can I perform post hoc tests for the mixed three-way repeated ANOVA using Real Statistics?
Thank you.
Cristian
Hello Cristian,
It depends on which significant result you obtained from the mixed three-way repeated ANOVA.
If you email me your test results, it would be easier for me to provide a more specific response.
Charles
Hi Charles,
How can I perform post hoc tests using Real Statistics for the Mixed Three-way Repeated Measures Anova: Two between subjects factor and one within subjects factor?
Thank you.
Cristian
Hello Charles,
I can’t find the Mixed Three-way Repeated Measures Anova data analysis tool and the other Repeated Measures ANOVA tools in your latest Real Statistics add-in.
Can you please help me on this? Thank you.
Best,
Cristian
Hello Cristian,
It is still in the same place. Press Ctrl-m and click on the Anova tab.
Charles
Ohh I’m sorry. I thought my version of the Real Statistics was the latest. It was v9.0.
Anyway, I got fixed. Thanks for the help.
Cristian
*got it fixed