When the Friedman test produces a significant result, we can conduct one of the following tests to pinpoint which pairwise groups have a significant difference (based on their rank sums or rank means).
- Nemenyi Test
- Conover Test
Alternatively, we can also conduct pairwise signed-ranks tests and then follow these up with one of the multiple test approaches described in Multiple Tests, namely the Bonferroni, Dunn-Sidàk, Holm, Hochberg, Benjamini-Hochberg or Benjamini-Yekutieli tests.
We now show how to use the Friedman Test data analysis tool to perform these post-hoc tests.
Nemenyi Post-hoc Test
The Nemenyi test (also called the Wilcoxon-Nemenyi-McDonald-Thompson test) is an adaptation of the Tukey HSD test, as described in Unplanned Comparisons, and controls for familywise error. It tests the difference between rank sums and uses the following standard error:
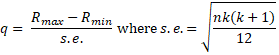
where k = the number of groups and n = the size of each of the group samples. The group sample sizes must all be equal. The statistic has a studentized range q distribution. The critical values for this distribution are presented in the Studentized Range Q Table based on the values of α, k (the number of groups) and df = ∞ (although some sources use df = n – k). If q > qcrit then the two means are significantly different.
This test is equivalent to
![]()
Picking the largest pairwise difference in means allows us to control the experiment-wise α for all possible pairwise contrasts; in fact, this test keeps the experiment-wise α = .05 for the largest pairwise contrast and is conservative for all other comparisons.
If we select the Nemenyi option in the dialog box in Figure 1 of Friedman Test Analysis Tool, then we obtain the output in Figure 1. We see there is a significant difference between white and rose’ wines (p-value = .049722), but not between white and red nor between red and rose’.
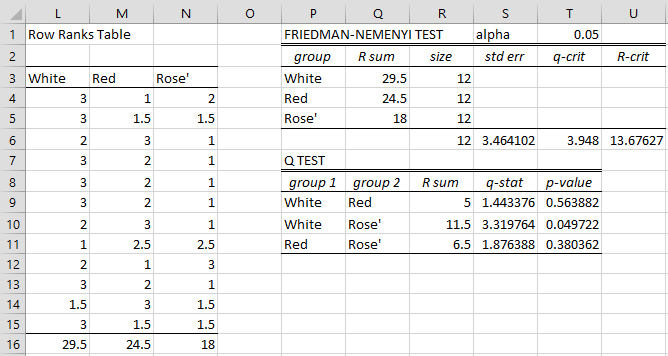
Figure 1 – Nemenyi Test
Some key formulas from Figure 1 are shown in Figure 2.
| Cells | Item | Formula |
| S6 | std err | =SQRT(R6*COUNT(R3:R5)*(COUNT(R3:R5)+1)/12) |
| T6 | q-crit | =QCRIT(COUNT(R3:R5),,T1,2) |
| U6 | R-crit | =S6*T6 |
| R9 | R-sum diff | =ABS(Q3-Q4) |
| S9 | q-stat | =R9/S$6 |
| T9 | p-value | =QDIST(S9,COUNT(R$3:R$5)) |
Figure 2 – Selected formulas from Figure 1
Conover post-hoc test
The Conover test is another post-hoc test used after a significant Friedman test. For this test. the test statistic has a t distribution given by
![]()
Groups i and j are significantly different if t > tcrit, or equivalently
![]()
where tcrit is the two-tailed critical value at α.
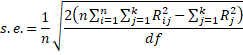
If we select the Conover option in the dialog box in Figure 1 of Friedman Test Data Analysis Tool, then we obtain the output shown in Figure 3.
Figure 3 – Conover Test
Note that Conover’s test does not correct for familywise error, and so you need to use some sort of error correction factor. if you plan on using all three pairwise comparisons, then, using a Bonferroni correction, we need to test the p-values against a corrected significance level of .05/3 = 0.016667 (the value in cell AB1). Since p-value = .012674 < .016667, we conclude that there is a significant difference between white and rose’ wines; once again we conclude there is not a significant difference between white and red nor between red and rose’.
Some key formulas from Figure 3 are shown in Figure 4.
| Cells | Item | Formula |
| Y3 | R-mean | =X3/COUNT(B4:B15) |
| Z6 | t-crit | =T.INV.2T(AA1,AA6) |
| AA6 | df | =(COUNT(L4:L15)-1)*(COUNT(L4:N4)-1) |
| AB6 | std err | =SQRT(2*(COUNT(L4:L15)*SUMPRODUCT(L4:N15^2)-SUMPRODUCT(L16:N16^2))/AA6)/COUNT(L4:L15) |
| AC6 | R-crit | =Z6*AB6 |
| Y9 | R-mean diff | =ABS(Y3-Y4) |
| Z9 | t-stat | =Y9/AB$6 |
| AA9 | p-value | =T.DIST.2T(Z9,AA$6) |
Figure 4 – Selected formulas from Figure 3
Note that the formulas in Figure 4 relate to the alpha value of .05. If you want to use .016667 instead, you need to substitute AA1 with AB1 in the formula in cell Z6.
Pairwise signed-ranks tests
Another approach to post-hoc testing is to use pairwise signed-ranks tests. In this case, we choose the Pairwise Signed Ranks option in Figure 1 of Friedman Test Data Analysis Tool for the signed-ranks tests using the normal approximation or the Pairwise Exact option to perform pairwise signed-ranks exact tests. The output for both of these options is shown on the left side of Figure 5.
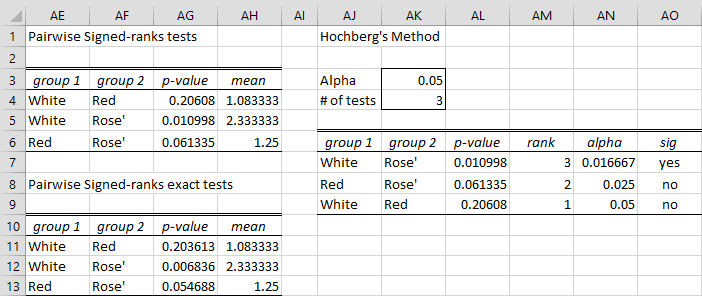
Figure 5 – Pairwise signed-ranks tests
Once again, some sort of familywise error correction is needed. In Multiple Tests, we describe a number of such tests, namely the Bonferroni, Dunn-Sidàk, Holm, Hochberg, Benjamini-Hochberg and Benjamin-Yekutieli tests.
E.g. to perform Hochberg’s test, press Ctrl-m and select the Multiple Tests option (found on the Misc tab if using the Multipage user interface). Then enter the range AE4:AG6 in the Input Range and select the Hochberg option. The output is shown on the right side of Figure 5. Once again, only white vs. rose’ is significant. If we wanted to use the pairwise signed-ranks exact tests, then we would have inserted the range AE11:AH13 in the Input Range field; the results would have been similar.
Examples Workbook
Click here to download the Excel workbook with the examples described on this webpage.
References
Pereira, D. G., Afonso, A., Medeiros, F. M. (2015) Overview of Friedman’s test and post-hoc analysis
Available through Researchgate
Demsar, J. (2006) Statistical comparisons of classifiers over multiple data sets. Journal of Machine Learning Research.
https://www.jmlr.org/papers/volume7/demsar06a/demsar06a.pdf
Dear Charles
Thank you. Simple and excellent explanation. Can these test be done using MINITAB/SPSS/SAS?
Nimalshanthi
I don’t use these tools, and so I don’t know for sure. I would guess that many of these post-hoc tests are supported by these software packages.
Charles
SPSS and JASP provide post hoc analysis for Freidman Test
Hi Carlos,
QCRIT function is equivalent to which in Excel?
Thanks!
Hello Carlos,
QCRIT is a Real Statistics function. You can use it like a true Excel function, but first, you need to download and install the free Real Statistics add-in.
For more information about QCRIT, see https://www.real-statistics.com/students-t-distribution/studentized-range-distribution/
Charles
Hi Charles,
I can’t calculate the q-crit. I can’t find the =QCRIT() function in excel. Can you explain this function?
=QCRIT(CONTAGEM(R3:R5),,T1,2)
Hello Carlos,
QCRIT is a Real Statistics function. You can use it like a true Excel function, but first, you need to download and install the free Real Statistics add-in, as described at https://www.real-statistics.com/free-download/real-statistics-resource-pack/
Charles
Can I ask how did you find out what groups have significant differences. It is stated that, If q > qcrit then the two means are significantly different. However, I can ‘t find the q value on the table. Sorry, I am new to this stats tool and I’m still trying to study it for my research. Thank you!
Hello Alyssa,
The q value is calculated from the data. The formula is displayed in the beginning of this webpage.
Charles
Hi,
Is the formula for Cell S6 correct? Specifically, is there supposed to be a 12 there or is the 12 supposed to be the sample size of your data? Since it uses “12” and not “R6” I can’t tell. Thanks.
=SQRT(R6*COUNT(R3:R5)*(COUNT(R3:R5)+1)/12)
Hello Maxwell,
It is a 12. The fact that the sample size is also 12 is a coincidence.
Charles
Hi Charles,
I’m trying to run the Nemenyi post-hoc test in Excel and cannot seem to find the QDIST function at all. Am I missing something? Need help ASAP!
Hi Carina,
QDIST is a Real Statistics function. You need to have the Real Statistics software installed. You can download this software for free.
Charles
Hello Charles
I ran the the Friedman-Nemenyi test on a sample of 7 years of annual snowfall data for 7 locations. The resulting Q-stat =22.49, p=.0004 rejecting the null hypothesis. However, none of the pairwise contrasts with the Nemenyi test are significant, p values range from 0.38 to 0.99. Is this reasonable?
Hello Gordon,
It can happen that the omnibus test yields a significant result, but none of the follow-up comparisons is significant.
However, with p = .0004 and the lower p-value for the comparison = .38 this is quite surprising.
If you email me an Excel file with your data and test results, I can check whether there is some sort of error.
Charles