Worksheet Functions
Real Statistics Functions: The following are array functions where R1 is an array that contains data in either raw or summary form (without headings).
MLogitCoeff(R1, r, lab, head, iter) – calculates the multinomial logistic regression coefficients for data in range R1. If head = TRUE then R1 contains column headings.
MLogitParam(R1, r, h, lab, head, alpha, iter) – calculates the multinomial logistic regression coefficients based on the data in R1 for one value h of the dependent variable (default: h = 1). If head = TRUE then R1 contains column headings. Includes the standard errors, Wald statistic, p-value, and 1 – α confidence interval.
MLogitTest(R1, r, lab, iter) – calculates LL of the full and reduced models, the chi-square statistic, the p-value for the data in range R1 (without headings), and the actual number of iterations performed
MLogitRSquare(R1, r, lab, iter) – calculates LL of the full and reduced models for the data in range R1 (without headings), the three versions of R2 (McFadden, Cox and Snell, Nagelkerke), AIC and BIC, and the actual number of iterations performed.
MLogit_Accuracy(R1, r, lab, head, iter): returns a column array with the accuracy of the multinomial logistic regression model defined from the data in R1 for each independent variable and the total accuracy of the model. Thus, if R1 contains k independent variables, then the output is a k+1 × 1 column array (or a k+1 × 2 array if lab = TRUE).
Function arguments
Here the parameters lab, head, r, alpha, and iter are optional.
When r = 0 (default) then the data is in raw form, whereas if r ≠ 0 the data is in summary form where the dependent variable takes values 0, 1, …, r.
When lab = TRUE then the output includes row and/or column headings and when lab = FALSE (the default) only the data is outputted.
The parameter alpha is used to calculate a confidence interval and takes a value between 0 and 1 with a default value of .05. The default value of head is FALSE.
The parameter iter specifies the number of iterations used in the Newton method for calculating the logistic regression coefficients; the default value is 20. If a smaller number of iterations is actually performed this is specified in the output from MLogitTest and MLogitRSquare.
More worksheet functions
The Real Statistics Resource Pack also provides the following array functions:
MLogitPred(R0, R1, r, iter) – outputs a 1 × rr row vector which lists the probabilities of outcomes 0, 1, …, rr (in that order) for the values of the dependent variables contained in the range R0 (in the form of either a row or column vector) based on the logistic regression model calculated from the data in R1 (without headings). If r = 0 (raw data) then rr = the maximum value in the last column of R1. If r ≠ 0 then rr = r.
MLogitPredC(R0, R2) – outputs a 1 × r row vector which lists the probabilities of outcomes 0, 1, …, r (in that order), where r = 1 + the number of columns in R2, for the values of the dependent variables contained in the range R0 (in the form of either a row or column vector) based on the logistic regression coefficients contained in R2. Note that if R0 is a 1 × k row vector or k × 1 column vector, then R2 is a (k +1) × (r – 1) range.
MLogitSummary(R1, head) – takes the raw data in range R1 and outputs an equivalent array in summary form. If head = TRUE then R1 contains column headings as well as the output.
MLogitSelect(R1, s, head) – array function which takes the summary data in range R1 and outputs an array in summary form based on s. If head = TRUE then R1 includes column headings as well as the output. The string s is a comma-delimited list of independent variables in R1 and/or interactions between such variables. E.g. if s = “2,3,2*3” then the data for the independent variables in columns 2 and 3 of R1 plus the interaction between these variables are output.
In addition, the Real Statistics Resource Pack contains the MLogitExtract function described in Finding Multinomial Logistic Regression Coefficients.
Examples
Figure 1 shows the use of some of the Real Statistics worksheet functions described above for Example 1 of Finding Multinomial Logistic Regression Coefficients (where the model data is in summary form). The output should agree with the output obtained from the Newton’s Method model shown in Figures 3, 4, and 5 of Finding Multinomial Logistic Regression Coefficients using Newton’s Method.

Figure 1 – Multinomial Logistic Regression functions
Some key formulas in Figure 1 are shown in Figure 2.
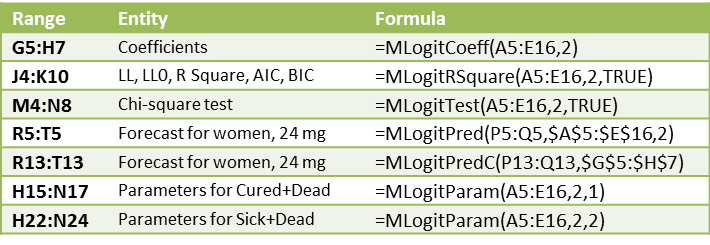
Figure 2 – Key formulas from Figure 1
We use the MLogitPredC formula in range R13:T13 to obtain the predicted values for the data in P13:Q13 based on the coefficients in G5:H7. We now show how to obtain the same values directly without using MLogitPredC. To do this, we use the range R10:T10 to hold some temporary values. Place the array formula =EXP(MMULT(P5:Q5,G6:H7)+G5:H5) in range S10:T10 and =SUM(S10:T10) in cell R10. Now place the formula =1/(1+C21) in cell R13 and the array formula =R11*S10:T10 in range S11:T11.
AIC and BIC
The AIC (Akaike’s Information Criterion) and BIC (Bayesian Information Criterion) statistics which are displayed as part of the MLogitRSquare function are calculated by the following formulas.
AIC = -2LL + 2(k+1)r BIC = -2LL + (k+1)r ln(N)
where N = the total number of observations. The use of these statistics is as described for binary logistic regression models in Real Statistics Functions for Logistic Regression.
More examples
Figure 3 shows the use of some of the Real Statistics functions described above for a multinomial extension to Example 2 of Finding Logistic Regression Coefficients using Newton’s Method (where the model data is in raw form). Here, the outcome 0 = female, 1 = male and 2 = hermaphrodite.

Figure 3 – Multinomial Logistic Reg. functions with raw data
Here range E5:I10 is calculated by =MLogitSummary(A5:C53), the range E14:E18 is calculated by =MLogitTest(A5:C53,0,TRUE) and the range H14:I18 is calculated by =MLogitTest(E5:I10,2,TRUE).
Model Accuracy
Example 2: Calculate the accuracy of the multinomial logistic regression model for Example 1 of Finding Multinomial Logistic Regression Coefficients (the data is duplicated in range A5:E17 of Figure 4).
We first show how to do the calculations manually in Figure 4.
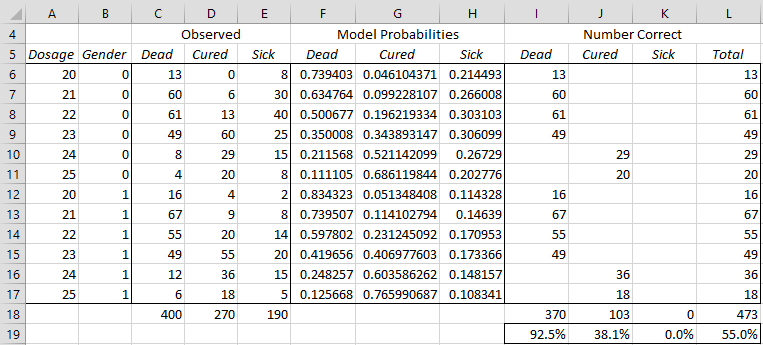
Figure 4 – Multinomial regression model accuracy
Range F6:H17 shows the probabilities predicted by the model for each data outcome. This is the output from the worksheet array formula =MLogitPred(A6:B17,$A$6:$E$17,2). We see, for example, that the highest probability for Dosage 20 and Gender 0 is Dead (.739403 in cell F6), and so 13 of the samples are predicted correctly and the other 0+8 = 8 are predicted incorrectly. The number of samples predicted correctly when the model predicts Dead is shown in column I, with columns J and K showing the number of samples predicted correctly when the model predicts Cured or Sick, respectively.
For example, cell I6 (for Dead) contains the worksheet formula =IF(F6>=MAX($F6:$H6),C6,””). Similarly, cell J6 (for Cured) contains the formula =IF(G6>=MAX($F6:$H6),D6,””) and cell K6 (Sick) contains the formula =IF(G6>=MAX($F6:$H6),D6,””). Cell L6 contains the total samples for row 6 predicted correctly by the model, namely 13, using the formula =SUM(I6:K6).
If we highlight the range I6:L17 and press Ctrl-D, we get all the correctly predicted sample values. Summing up each column, we get the values in I18:L18. Dividing these values by the values in range C18:E18, we get the percentage correct shown in range I19;L19.
In particular, we see that the model only predicts 55% of sample elements correctly.
We can obtain the same result using the array formula
=MLogit_Accuracy(A5:E17,2,TRUE,TRUE), as shown in Figure 5.
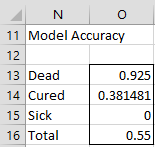
Figure 5 – Model accuracy
Data Analysis Tool
Real Statistics Data Analysis Tool: The Real Statistics Resource Pack supplies a Multinomial Logistic Regression data analysis tool that automates many of the capabilities described above.
For example, to perform the analysis for Example 1 of Finding Multinomial Logistic Regression Coefficients using Newton’s Method, press Ctrl-m and double-click on the Regression option in the dialog box that appears. Next, click on the Multinomial Logistic Regression option in the dialog box that appears and click on the OK button. This will bring up the dialog box shown in Figure 6.

Figure 6 – Multinomial Logistic Regression dialog box
Fill in the fields as shown in Figure 6. Note that columns A and B contain the data for the independent variables, and so you enter the number 2 in the # of Independent Variables field. When you press the OK button, the output displayed in Figure 7 will appear.
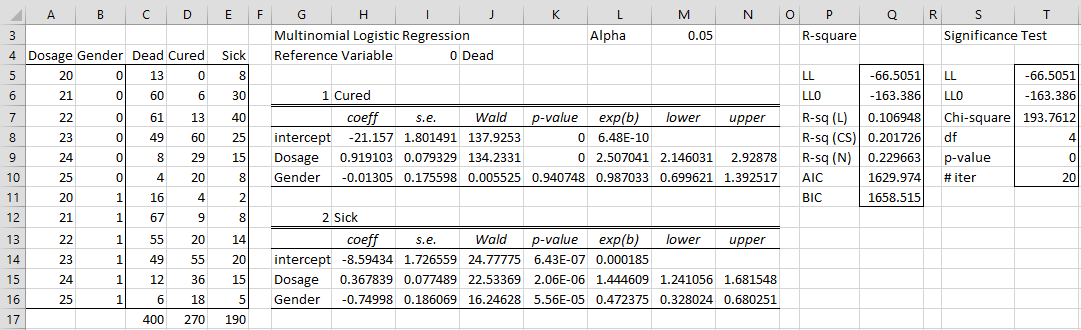
Figure 7 – Output for summary input data
To perform the analysis for Example 1, follow the steps described above. When the dialog box shown in Figure 6 appears, insert the range A4:C53 (from Figure 5) in the Input Range field.
Since the input range has 3 columns and the # of Independent Variables is 2, this leaves only one column for the dependent variables. The software knows that this means that the input data was formatted in raw data format.
The output will appear as shown in Figure 8

Figure 8 – Output for raw input data
Note that the output contains the summary data shown in range E6:I4, as well as output based on this summary data that is formatted as in Figure 7.
Examples Workbook
Click here to download the Excel workbook with the examples described on this webpage.
References
Wikipedia (2014) Multinomial logistic regression
https://en.wikipedia.org/wiki/Multinomial_logistic_regression
Field, A. (2005) Discovering Statistics Using SPSS. 3rd ed. Sage
https://profandyfield.com/discoverse/dsus/
Cheng, H., (2021) Multinomial logistic regression
https://bookdown.org/chua/ber642_advanced_regression/multinomial-logistic-regression.html
Hi thank you so much for this. I just want to know which indicates the multiple correlation coefficient? Thank you very much
Hello Dawn,
This tool doesn’t output the multiple correlation coefficient. I am not sure what this would serve.
Charles
Hi Charles,
Thank you for the very generous information here. I am currently attempting to design a model with one independent variable and discrete outcomes ranging from -2 to 2 (excluding 1). It is for the game of cornhole, I am attempting to predict the probability of the next throw going in depending on the distance of the first throw from the hole. I am attempting to use the multinomial regression tool, but I receive the following error: “Last column of input range must contain all the values 0, 1, 2, …, r and only these values where r=max value in last column of input range(r must be<25)". I have read some of the other comments on here, but they did not help me. I am not sure if it is because all of my dependent variables are in 1 column. Thank you in advance.
Best,
Zach
Hi Zach,
1. If I understand correctly, the acceptable values for the dependent variable are -2, -1, 0, 2. You can use multinomial logistic regression provided that you don’t need to take the order of these four values into account. Also, in this case, you need to recode the four values as 0, 1, 2, 3 and use the Raw data option since all the dependent variable values are in one column.
2. If you need to take the order into account, then use should use ordinal logistic regression.
Charles
Dear Charles Zaiontz
Thanks for providing such an enormous remote support to us.
I have a trial license for xlstats to do a MNL regression
I created my datasets earlier with SPSS which allowed me to have multiple values / responses for each categorical variable.
I have curious Beta and Exp B outputs
Now i want to do the same MNL with other statistical software
I tried Excel but no MNL possibility. So I exported the datasets from SPSS to Excel, created dummy variables wfor each categorical response variable using the “if” statements.
I am.now trying Xlstat but having a problem of knowing whether i have to click the column label/ header of my dummy response variables or I have to select the entire column of the dummy variable.
Secondly, I see you use Reslal statistics pack
Is it free?.where can I download it?
Thanks
Hello Nsikan-George,
Yes, Real Statistics is free. You can download it at Real Statistics Download
Charles
Hi
I want to learn how to use the Multinomial Regression Analysis / But when i go to
Data > Data Analysis / I cannot find the Multinomial Regression Tool /
Do I select the ”Regression” Option? / Does this option also carry out the Multinomial Regression Analysis?.
From the note above, you will understand that i am a beginner at Statistical Analysis, so any guidance would be greatly appreciated.
Thankyou
Charles
Hello Charles,
The Regression option of Excel’s data analysis tools performs multiple linear regression. It does not perform multinomial logistic regression.
This webpage describes the multinomial logistic data analysis tool provided by the Real Statistics Resource Pack. You need to install the Real Statistics Resource Pack first and then you can get access to the multinomial logistic data analysis tool.
Charles
Dear Charles,
I have tested Multinomial Logistic Regression in my data.
I used analysis tools, but I have a question about r.
In my data, there are 4 independent variables and 1 dependent variable.
So, I enter 4 at second box then press OK.
After press OK, I have a message like this.
In website, enter the r=0 in raw form. But there isn’t any box about r in tool.
What is the meaning of that message? And what is r? How to enter the r value in tool?
regards,
Gibyung
Gibyung,
The r argument is used in the functions defined on the webpage. When r=0 the raw data format is used.
In the Real Statistics data analysis tool, r is not requested. Instead the number of independent variables is requested. If this value is k and the number of columns in the input is n, then r = n-k-1. Thus the program knows that if say the input has 6 columns and you enter 5 as the number of independent variables, then r = 6-5-1 = 0 and so the 6th column contains values 0 through m-1 where m is the largest value in the 6th column.
I don’t see a message of the type you are referring to. What is the wording of the message you received?
Charles
Dear Charles,
Sorry for missing the message.
Last column of input range must contain all the values 0, 1, 2, …, r and only these values where r=max value in last column of input range(r must be<25)
This is the message. You already explained about it.
That means, it is need to change dependent variable column values to 0~r-1 values? I have entered the values of last column 1~174.
Regards,
Gibyung
Gibyung,
If there are n columns in your input range and you enter n-1 in the # of Independent Variables field, then as the error message explains then last column represents the values of the dependent variable. If the maximum value of these values is say 8, then the dependent variable will take the values 0 through 10. There should be at least one occurrence of 0, 1, 2, 3, 4, 5, 6, 7 and 8. The maximum value cannot be higher than 24 (otherwise you will see the error).
Charles
Hi Dr Zaiontz,
I have a problem with #VALUE! thing. At first i had thought that it could be caused by unproper data but i tried to make it with data from Example 1 and it didn’t work. Could you tell me what are the possible reasons of my problem?
Martin,
I have tested Example 1 and it should work.
If you send me an Excel file with your data and the analysis you performed for Example, I will try to figure out what went wrong.
You can find my email address at Contact Us.
Charles
Hi Dr. Zaiontz
Is there a row/column limit for the multinomial logistic regression function? I can’t seem to make it work with my 370 x 7 dataset.=(
Regards,
Astrid
Astrid,
The limit is much bigger than 370 rows and 7 columns. The limit is a little more than 65,000 cells, and even then I show ways of exceeding this limit.
When you say that it doesn’t work for a 370 x 7 data set, do you mean that you get error cells. The likely reason for this is that the logistic regression model doesn’t converge to a solution, which is an indication that the model is not a good fit for the data.
Charles
Hello Dr. Zaiontz,
Yes I get #VALUE! error. I was trying to create a classification model using multinomial logistic regression, and since I am not able to make it work, I ended up running multiple logistic regressions per class. It worked and it gave me an ok score at kaggle. I’m new to this predictive modeling thingy and may I ask if a multinomial logistic regression would yield different results as doing multiple logistic regressions per class?
regards,
astrid
Astrid,
The results may be different, although maybe only marginally so. This is shown on the website, when I show how to use multiple binary logistic regressions to generate a multinomial logistic regression model.
Charles
Dear Charles,
In the output for a multinomial regression analyses using 10 independent (categorical, and numberical) and 1 dependent variable (categorical, 0,1) the table with the coefficients contains “#VALUE!” only.
What in my input table can cause this output?
Thank you,
Silke
Silke,
If your dependent variable has only values of 0 and 1, then you should use binary logistic regression and no multinomial logistic regression. If you get #VALUE! cells, the likely cause is that the logistic regression model doesn’t fit the data (perhaps because your sample is too small).
Charles
Hi Charles,
How can I know the goodness of model with the value of Chi square and P value?
Anson
Anson,
See Goodness of Fit
Charles
Hi Charles,
How to set the column “#of interaction” in Multinomial Logistic Regression dialog box?
Thanks,
Anthony
Anthony,
There is no # of Interaction option. Are you trying to factor interactions into the model?
Charles
Hi Charles,
When I use =MLogitParam(F4:I53,1,1,TRUE,TRUE,0.05,20)
coeff,se,Wald will shown “#VALUE!”.
But when I change the formula to =MLogitParam(F4:I53,1,1,TRUE,TRUE,0.05,20), then everything is alright.So what is the difference of 20 and 17 in the above formula?
Thanks
Anthony,
You wrote 20 in both formulas. Which one gives the correct value: 20 or 17?
Charles
Charles,
Interation >17 will shown “#VALUE!”, otherwise <18 will shown value, but I don't know which value is correct. So how can I know which value I can use?
Thanks
Anthony,
If you send me an Excel file with your data and analysis, I will try to figure out why this strange situation is occurring. You can find my email address at Contact Us.
Charles
Charles,
Have sent the email to you
Thanks
Charles,
Have any news of my attachment?
Also my attachment columns A are alphanumeric data converted to numeric form.
So , where can I find Coeff of 4 and Coeff of 1
Thanks
hey, I am trying to run multinomial logistic regression but the MLogitParam function gives a value error along with other functions as well. Could you shed some light on the fix for it.
The usual reason is that either (1) there is some illegal data value or (2) logistic regression is not a good fit for the data.
If you send me an Excel file with your data and analysis I will try to figure out what is going on. You can find my email address at Contact Us.
Charles
Hi,
thank you very much for this extremely valuable resource.
i am trying to run a multinational logistic regression regression on some survey data but the MlogitParam gives me a value error.
could you help me with that.
Giovanni,
If you send me an Excel with your data and analysis I will try to figure out what is happening.
You can get my email address at Contact Us.
Charles
Hi Dr. Zaiontz
Thank you for your very useful website. I faced with a problem some days and I tried to fine a suitable answer but I couldn’t. please help me:
I Perform an Interview. I have a protocol to do that. It consist of 44 questions. I understand someone say them observed variables. For Analyse, latent variables are built from nominal and ordinal variables. I want to find correlation coefficient between latent variables but I don’t know how to define latent with nominal and ordinal variables? how can I mix/ combine/ merge nominal with ordinal to build a unique latent variable, after that I can test correlation between those latent( new) variables.
Thanks for your guidance.
Pooya Ghazinejad
Hello Pooya, but I don’t understand the situation that you are describing well enough to be able to give you a meaningful answer.
Charles
Yes Dr Zaiontz, You are right. so If you let me, I describe it more:
I Perform an Interview with 44 questions Protocol. The Structure of questions are based on 18 Variables. Major variables are coming from theory. Every major variable consist of 3,4 or more questions. In fact I want to compare every major variable with each other and find correlation coefficient. Now for analyze when I want to build major variable with available data, I have problem. for example:
major variable(1): organizational Justice consist of tow nominal data( tow questions of interview protocol with nominal categories) and one ordinal( one question of interview protocol with ordinal categories) .
major variable(2): organizational trust consist of three ordinal data and tow nominal.
Now my available data are the combination of ordinal and nominal. I don’t know how merge nominal with ordinal data to build a unique variable( The major variable base on theory, in above example V(1) and V(2)).
Thanks
Hello Pooya,
You say that you want to “compare every major variable with each other and find correlation coefficient”. If the data is ordinal this makes sense, but what is your goal if the data is categorical. E.g. if x = Income and y = party affiliation (Democrat, Republican, Other), then the correlation coefficient really doesn’t make much sense. In this case, it may be better to compare the values of x for each of the three party affiliations. This is essentially what Anova does.
If z = gender (Male, Female), the once again the correlation coefficient for y vs. z doesn’t (party vs. gender) really make much sense. In this case, it makes more sense to compare the number of people in the sample in each of the 2 x 3 combinations (MD, FD, MR, FR, MO, FO); this is essentially what chi-square test for independence does. You can achieve the same thing using the correlation coefficient on dummy variables as explained on the webpages
Relationship between Correlation and t test
Relationship between Correlation and Chi-square
Charles