Introduction
The approach described in Finding Multinomial Logistic Regression Coefficients doesn’t provide the best estimate of the regression coefficients. In fact, you can achieve a higher value of LL by using Solver.
Solver Approach
Referring to Figure 2 of Finding Multinomial Logistic Regression Coefficients, set the initial values of the coefficients (range X6:Y8) to zeros and then select Data > Analysis|Solver and fill in the dialog box that appears with the values shown in Figure 1 (see Goal Seeking and Solver for more details) and then click on the Solve button.

Figure 1 – Solver dialog box for Multinomial Logistic Regression
Results
The result is displayed in Figure 2 and 3.
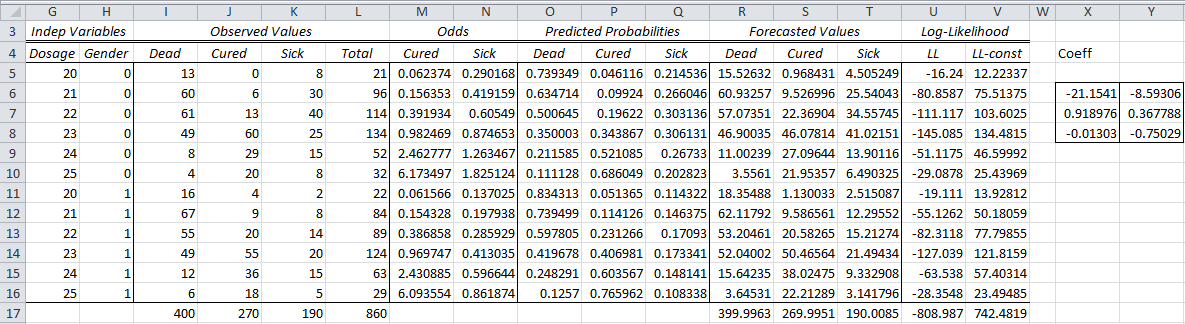
Figure 2 – Multinomial logistic regression using Solver (part 1)
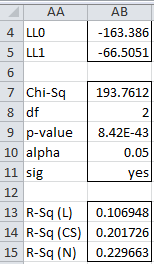
Figure 3 – Multinomial logistic regression using Solver (part 2)
As you can see the value of LL calculated by Solver is -163.386 (see Figure 3), which is a little larger than the value of -170.269 calculated by the binary model (see Figure 4 of Finding Multinomial Logistic Regression Coefficients).
Significance Testing
To test the significance of the coefficients (the equivalent of Figure 5 of Finding Multinomial Logistic Regression Coefficients for the Solver model) we need to calculate the covariance matrix (as described in Property 1 of Finding Multinomial Logistic Regression Coefficients). This is shown in Figure 4.

Figure 4 – Calculation of the Covariance Matrix
The covariance matrix displayed in Figure 4 is calculated using the formulas shown in Figure 5.
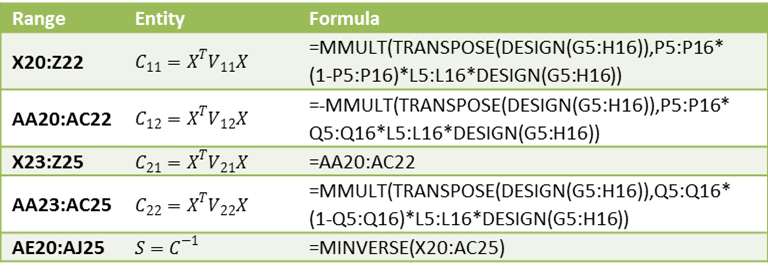 Figure 5 – Formulas used in Figure 4
Using the results in Figure 2 and 4, we get the result shown in Figure 6.
")
Figure 6 – Multinomial logistic regression using Solver (part 3)
The key formulas used to calculate the Cured + Dead table are shown in Figure 7 (the Sick + Dead table is similar).
 Figure 7 – Key formulas in Figure 6
Predictions
The forecasted probabilities, based on the multinomial logistic regression model using Solver, of the three outcomes for men and women at dosages of 24 mg and 24.5 mg is displayed in Figure 8.

Figure 8 – Forecasted probabilities using Solver
Examples Workbook
Click here to download the Excel workbook with the examples described on this webpage.
References
Wikipedia (2014) Multinomial logistic regression
https://en.wikipedia.org/wiki/Multinomial_logistic_regression
Field, A. (2005) Discovering Statistics Using SPSS. 3rd ed. Sage
https://profandyfield.com/discoverse/dsus/
Cheng, H., (2021) Multinomial logistic regression
https://bookdown.org/chua/ber642_advanced_regression/multinomial-logistic-regression.html
Agresti, A. (2002) Categorical data analysis, Wiley & Sons
Hi Charles, How can I calculate the Pearson chi square value using the example presented in this section?
Raul,
This is explained for binary logistic regression at
https://www.real-statistics.com/logistic-regression/significance-testing-logistic-regression-model/
The approach for multinomial logistic regression is the same.
Charles
Thank you Charles, you are great and very kind
Hello Sir,
How to compute the confusion matrix for the example as shown above using Excel? Also I could not understand the GAMMALN(x) part as well. Why we are using this?
Sorry, but I don’t know what you are referring to. I don’t see GAMMALN on this webpage nor a confusion matrix.
Charles
Hi Charles – Thank you. I’ve really enjoyed your site!
I’m trying to determine the probability weighted average of an financial index under four independent variables. The data is broken down as the following:
* 80 observations (quarterly returns) that are observed under 4 independent scenerios 19/25/20/16 is breakdown. Would you recommend using logistic or multinomial regression to determine the probabilities for each observation? For example, I put the 80 observations into logistic regressions model and under the 1st scenario I had 19 successes and 61 failures which gave me the probabilities for each of the 19 quarterly returns. I repeated this for the other 3 scenarios. I think the intercept and slope is too low. Not sure how I would estimate this. Is this the right way to think about this? Any help is greatly appreciated.
Hi Aaron,
If you have 4 possible non-overlapping outcomes, then probably multinomial logistic regression is the better choice. If there is an order to the 4 possible outcomes, the ordered multinomial logistic regression is best.
Charles
Dear professor Charles,
First of all, thank you for your kindness of making this add-ins for excel users. This is so much helpful especially for students who want to understand statistics more deeply.
I am trying to understand the estimation of the winning probabilities of the horse in a horse racing but I am confused that which model I should use. Should it be logistic regression or multiple logistic regression? From the book that I have read, it suggests to use multiple logistic regression but I do not understand because the dependent variable is binary (win/lose) then why it is multiple logistic regression. I hope that if I can replicate the result from mlogit package and this add-ins will help me understand this more.
If you could hint me how to do or explain why horse racing probabilities can be calculated from multinomial logistic regression, it would be very much appreciated.
Hello,
It really depends on what you are trying to predict. If it is the probability that horse A wins, then logistic regression could be a reasonable approach. Binary logistic regression would be reasonable with two horses (horse A wins equals horse B loses). When you have more than two horses (the usual situation), then multinomial logistic regression would be reasonable since it predicts the probability that horse A wins and the probability that horse B wins, …, and the probability that horse H wins (assuming 8 horses in the race).
Charles
Hi
I have a database of Race Horse results.
I have been trying to self teach myself as to how to do Linear Regression,
I am slowly getting there, but at times i get stuck.
From reading articles on the Net, i have learn’t that in some cases i will have 2 dependent variables and up to 15 independent variables.
Do i use Multinomial Logistic Regression to find the probability of horse winning at its next run / And as the example shows above, i would like to be able to convert the probability into odds,
If you like i can send you a sample of my database / where you can do a small example
eg 1 dependent variable and say, 3 independent variables.
Ps i had a look on excel ”Data Analysis” tab and i cannot find Multinomial Regression”
I have the latest excel software / Can you please give me a some guidance as to how
to find this
Thanks and Merry Xmas
Charles
Charles,
1. If say there are 8 horses, you can use multinomial logistic regression to show the probability of each horse winning.
2. odds = p/(1-p)
3. The Multinomial Logistic Regression data analysis tool is not provided by Excel’s Data analysis tab. It is provided by the Real Statistics Resource Pack, which you can download for free from the Real Statistics website.
Charles
Hi Charles,
If were rather using multinomial regression to predict one of three outcomes, then what is the criteria used to determine the final outcome? Do we just pick the predicted outcome with highest probability.
Thanks
If I had to choose just one of the outcomes, then I too would choose the one with the highest probability.
Charles
Thanks much
is there any way you could post the spreadsheet you are using so that some of the values and where they came from are more clear? thanks,
Please see the following webpage:
Examples Workbooks
Charles
Hi Charles,
As per your above samples, how can I find the p value of dead?
Anson
Anson,
There probably is a way to do this based on the analysis already done, but I can’t think of it at this moment. Instead, you can reanalyze the original data taking one of the other variables (e.g. Gender) and the base variable.
Charles
I’ve been working with a political campaign and decided to try a logistic regression to get a rough predictive formula for the likelihood of an individual voter showing up to the polls. My LL seems really low though, around -12,000. is this something that would indicate I did something wrong?
Ed,
The value of LL really depends on the nature of your data, and doesn’t necessarily mean that you have done something wrong.
Charles