Pairwise binary logistic regression
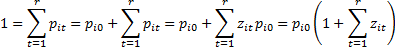
Suppose there are r + 1 possible outcomes for the dependent variable, 0, 1, …, r, with r > 1. Pick one of the outcomes as the reference outcome and conduct r pairwise logistic regressions between this outcome and each of the other outcomes. For our purposes, we will assume that 0 is the reference outcome. The binary logistic regression model for the outcome h, with h ≠ 0, is defined by

Here pih is the probability that the ith sample has outcome h. Taking the exponential of both sides of the above equation yields the equivalent expression
![]()
where we define xi0 = 1 (in order to keep our notation simple). Now let
![]() and so
and so
![]() But
But
 Hence
Hence
![]() and
and
![]()
Use of the multinomial distribution
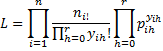
Whereas the model used in the binary case with only two outcomes is based on a binomial distribution, where there are more than two outcomes, the model we use is based on the multinomial distribution. Thus, the probability that the sample data occurs as it does is given by
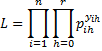
where the yih are the observed values while the pih are the corresponding theoretical values.
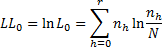
Taking the natural log of both sides and simplifying we get the following definition.
Definition 1: We define the log-likelihood statistic for multinomial logistic regression as follows:

Properties
The multinomial counterparts to Property 1 and 2 of Finding Logistic Regression Coefficients using Newton’s Method are as follows.
Property 1: For each h > 0, let Bh = [bhj] be the (k+1) × 1 column vector of binary logistic regression coefficients of the outcome h compared to the reference outcome 0 and let B be the r(k+1) × 1 column vector consisting of the elements in B1, …, Br arranged in a column.
Also let X be the n × (k+1) design matrix (as described in Definition 3 of Least Squares for Multiple Regression). For outcomes h and l let Vhl be the n× n diagonal matrix whose main diagonal contains elements of form
![]()
and let Chl = XTVhlX. Now define the nr × nr matrices
 and S = C-1. Then S is the covariance matrix for B.
Property 2: The maximum of the log-likelihood statistic occurs when for all h = 1, …, r and j = 1, …, k the following r(k+1) equations hold
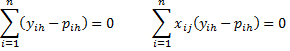
Observation: Let Y = [yih] be the n × r matrix of observed outcomes of the dependent variable and let P = [pih] be the n × r matrix of the model’s predicted values for the outcomes (excluding the reference variable). Let X be the n × (k+1) design matrix. Then the matrix equation
![]()
where the right side of the equation is the (k+1) × r zero matrix, is equivalent to the equations in Property 2.
Newton’s method iteration
Property 3: Let B, X, Y, P and S be defined as in Property 1 and 2, and let B(0) be an initial guess of B, and for each m define the following iteration
![]()
then for sufficiently large m, B(m+1) ≈ B(m), and so B(m) is a good approximation of the coefficient vector B.
Here we can take as the initial guess for B the r(k+1) × 1 zero matrix.
Observation: If we group the data as we did in Example 1 of Basic Concepts of Logistic Regression (i.e. summary data), then Property 1 takes the form
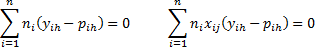
where n = the number of groups (instead of the sample size) and for each i ni = the number of observations in group i.
Property 2 also holds where Y = [yih] is the n × r column vector of summarized observed outcomes of the dependent variable, X is the corresponding n × (k+1) design matrix, P =[pih] is the n × r column vector of predicted values and Vhl is the n × n diagonal matrix whose main diagonal contains elements of form
![]()
Thus, the element in the jth row and mth column of Chl is

Log-likelihood
In this case, the expressions for L and LL become

The values of LL and R2 as well as the chi-square test for significance are calculated exactly as for binary logistic regression (see Testing the Fit of the Logistic Regression Model).
As for LL, to the above formula, we need to add the constant term

Note, however, that in calculating the different versions of R2, the constant term is not included in LL and LL0.
References
Wikipedia (2014) Multinomial logistic regression
https://en.wikipedia.org/wiki/Multinomial_logistic_regression
Field, A. (2005) Discovering Statistics Using SPSS. 3rd ed. Sage
https://profandyfield.com/discoverse/dsus/
Cheng, H., (2021) Multinomial logistic regression
https://bookdown.org/chua/ber642_advanced_regression/multinomial-logistic-regression.html
Agresti, A. (2002) Categorical data analysis, Wiley & Sons
Dear Charles,
From property 1, we know that C is a nr × nr matrix with S is the inverse of C, which means S is also a nr × nr matrix. But in property 3, the iteration equation, the dimension of the transpose of X is k+1 × n which will cause a non-conformable arguments. I am wondering whether I miss or misunderdtand something.
Thanks
Ziv
I’m afraid this might sound stupid but wouldn’t Zi0=Pi0/Pi0=1?
Some textbooks refer to the probability of any outcome as Zih/sum(Zit) for all h including class h0 (t also starts from 0 so there is no “1+…” in the denominator).
Mohammed,
Yes, Zi0=Pi0/Pi0=1. I believe that I used this fact when the lower bound of the sum changed from i = 0 to i = 1.
Charles
Thanks for your reply dr. Charles, I think you meant t=0 as a lower bound for the sum of probabilities (fifth equation) and after you take the reference outcome out t starts from 1.
Thanks again for your great effort.
Good morning Charles.
As for property 3 being used for Newton’s Method I understand that ‘m’ is the number of iteration and P is for the predicted probabilities.
Then what does p(m) means? for the formula used in Newton’s Method
Sorry, but I don’t see p(m) on this webpage.
Charles
Charles: Does this approach require grouped data? I have tried it with data such as the famous IRIS dataset and it seems to break down when most of the independent variable combinations are unique, i.e. when the N’s are 1. What happens is that the standard errors of the betas become negative. Is there an adjustment that can made for these cases? Thanks.
Will,
It should also work for raw data. If you email me an Excel file with your data and results, I will take a look at what is happening.
Charles
Dear Charles,
I installed Microsoft office 2010, in the mean time the problem of downloading realstat 2007 easily solved.
Thanks
When I enter the following formula in any cell? =VER() it gives me 3.0 I download realstat-2007 pac. I browse the pac and then I checked realstat-2007 from add-in list. An error message saying” Excel experienced a serious problem with the realstat-2007 add-in. Can you help me in solving this problem?
Sisay,
This is a very old version of the software. I suggest that you download a new version from the website.
Charles
Dear Charles,
I download RealSTATS-2003 but How can use this package to calculate Multinomial Logistic Regression?
Thanks
Sisay,
Since Microsoft stopped supporting Excel 2003 I have not added new features to the Excel 2003 version of Real Statistics. You need to use the Excel 2007, 2010 or 2013/2016 versions of Real Statistics to get this capability.
Charles
Dear Charles,
What should I do if the variance-covariance matrix is a singular matrix?
Are there any solution for this problem?
Dear Eki,
There are approaches in when the variance-covariance matrix is not invertible, but these go beyond the score of the website. You can find some of these by googling.
Charles
Dear Charles,
From the literature, what would you suggest as a rule to define the minimum sample size (1) for the binomial logistic regression, (2) for the multinomial logistic regression? E.g. a rule based on the number of independent variables, the observed proportions related to each possible outcome of the dependent variable. Should such a threshold be defined by considering the possible outcomes separately (e.g. the minimum observed proportion across the outcomes), or considering all rows (combinations of outcomes) of the summary table. Thanks.
Thomas,
The following webpage may be helpful to you
http://imaging.mrc-cbu.cam.ac.uk/statswiki/FAQ/power/llogN
Also G*Power provides a capability to calculate the sample size required for logistic regression.
Charles
Dear Charles,
Many thanks for this very useful material. I’d like to know if, even if probably similar to the binomial case, you could add a section on the comparison of regression models. In particular, I’d be also interested to know if LL0 is supposed to remain identical from one model to the other (I think it however depends on the way the summary table is designed, due to non linearity in the LL0 formula), and if the degrees of freedom can also be simply subtracted.
Many thanks in advance,
Kr,
Thomas
Thomas,
What sort of comparison are you looking for? When you use one model rather than another?
The LL0 values won’t be identical from model to model. Generally, they will be identical only when the summary data are identical.
Charles
Dear Charles,
Thanks for your prompt answer. I’m thinking of nested models, exactly as illustrated in the binomial case; with a chi-square test based on log likelihoods, and a substitution of LL0 by the LL1 related to the reference model. Is it valid for the multinomial case, provided we keep the summary table identical for all models? Once the final model selected, I’ll try to define a classification matrix based on RS capabilities.
Thomas
Sorry Thomas, but I don’t understand the approach that you are suggesting. I am not saying it is wrong; I just don’t understand it.
Charles
No problem. I’m thinking of the comparison of a base model and an extended model, as done in section https://real-statistics.com/logistic-regression/comparing-logistic-regression-models/
but for the multinomial case.
Thanks and cheers,
Thomas
Thomas,
I believe the same approach used for binary logistic regression will also work in the multinomial case.
Charles
All I want to figure out is how do get the population and sample for a multinomial logistic regress. I have four generational cohorts and five soft skill categories that I will be testing.
Jackie
Jackie,
Please explain what you mean by “how do [I] get the population and sample for a multinomial logistic regress”
Charles
Sir
When h j the element of v matrix is vii = (-1)*ni*Pih*Pil, but it seems in Excel Workbook you forget the term -1, why?
Colin
Sir
Sorry! My apology. You are right sir!
Colin