On this webpage, we describe Real Statistics’ support for chi-square independence testing with missing data.
Worksheet Functions
Real Statistics Functions: The Real Statistics Resource Pack provides the following array functions. Here, R1 is an m+1 × n+1 array, the last row and last column of which contain counts of missing elements.
EM_CHISQ(R1, iter, prec): outputs an m × n array with the pij parameter values
EM_CHISQ_IMPUTE(R1, iter, prec): outputs an m × n array with the xij data and imputed values
EM_CHISQ_EXP(R1, iter, prec): outputs an m × n array with the pij parameter values based on independence
EM_CHISQ_EXP_IMPUTE(R1, iter, prec): outputs an m × n array with the xij data and imputed values based on independence
EM_CHISQ_TEST(R1, lab, iter, prec): outputs a 3 × 1 array containing the chi-square statistic, df, and p-value of the test for independence. If lab = TRUE (default = FALSE), then a column of labels is appended to the output.
iter = the maximum number of iterations (default 100). If none of the imputed values change by more than prec (default 0.00000001), then the iteration terminates.
Data Analysis Tool
Real Statistics Data Analysis Tool: We can use the Real Statistics Chi-square Test for Independence data analysis tool when there is missing data by selecting the Contains missing data option.
To use this data analysis tool for Example 1 of Independence Testing with Missing Data, press Ctrl-m. Next, choose the Chi-square Test for Independence option from the original user interface (or from the Misc tab of the Multipage interface). Finally, fill in the dialog box that appears as shown in Figure 1 and press the OK button.
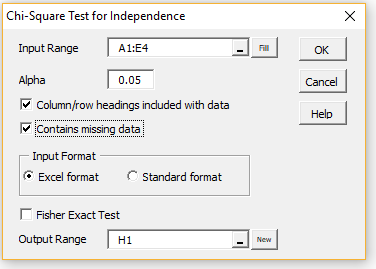
Figure 1 – Chi-square Test for Independence dialog box
The output is shown in Figure 2.
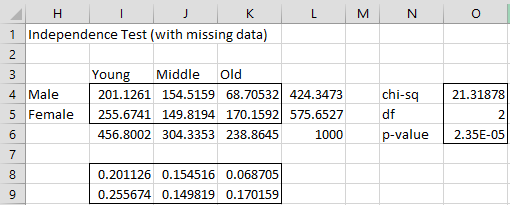
Figure 2 – Data analysis output
The missing data must be specified in the last row and last column. If the Fisher Exact Test option is checked, then the test is run on the imputed data (range I4:K5 of Figure 2 for Example 1 of Independence Testing with Missing Data).
Standard Format
Only the three-column version of the Standard format is supported when the Contains missing data option is selected. In this case, you must choose a label for the missing data that comes after the other labels in the sort order. This will ensure that when the data is transformed into Excel format, the missing data will occur in the last row and last column. Some good choices for the missing data label are the symbol ^ or § (or text beginning with ^ or §).
For example, suppose the data for Example 1 of Independence Testing with Missing Data is formatted as shown on the left side of Figure 3.
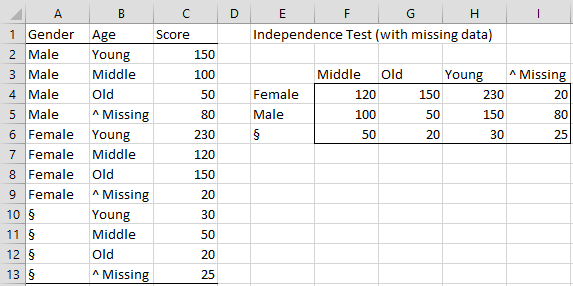
Figure 3 – Standard Format
In the dialog box in Figure 1, you would enter A1: C13 in the Input Range field, check the Column/row headings included with data and Contains missing data options, and select Standard format. Upon clicking the OK button, the Excel-formatted data shown on the right side of Figure 3 would appear, followed by the output shown in Figure 2.
Examples Workbook
Click here to download the Excel workbook with the examples described on this webpage.
Links
References
Ehlers, R. (2005) Incomplete contingency tables
No longer available online
Howell, D. (2008) The treatment of missing data
https://www.uvm.edu/~statdhtx/StatPages/Missing_Data/MissingDataFinal.pdf