Basic Concepts
We now show how to conduct the chi-square test for independence even when there is missing data by using the EM approach described in Contingency Tables with Missing Data.
If the row and column variables of a contingency table are assumed to be independent, then we can apportion the missing data using an EM algorithm as described in Contingency Tables with Missing Data. The E step is as described previously, but the M step takes the form:
![]()
Example
Example 1: Determine whether the Gender and Age measurements from Example 1 of Contingency Tables with Missing Data are independent.
The EM algorithm then starts off as described in Figure 1.

Figure 1 – EM algorithm assuming independence (iterations 1, 2)
The formulas are the same as in Figure 2 of Contingency Tables with Missing Data, except that cell O15 contains the formula =X9*U11/K11^2 (and similarly for the other cells in range O15:Q16).
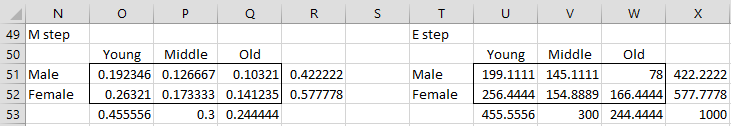
Figure 2 – Convergence of the EM algorithm
Continuing in this fashion, we arrive at the results shown in Figure 2 after 8 steps. The result after 9 steps is identical (at least to the precision shown in the figure).
We now use the chi-square comparison test to determine whether there is a significant difference between the maximum log-likelihood estimates based on the p parameter estimates shown in Figure 3 of Contingency Tables with Missing Data and Figure 2.
There are two versions of LL, namely LL1 based on the full model (as shown in Figure 4 of Contingency Tables with Missing Data) and LL0 based on the reduced model assuming independence, which can be calculated in the same way from the p parameter estimates in Figure 2 (as shown in column C of Figure 3).
We now perform the chi-square comparison test using the following formula, as shown in Figure 3
![]()
where df = (r–1)(c–1).
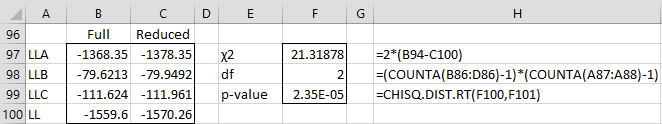
Figure 3 – Chi-square Comparison Test
Conclusions
Since the p-value is quite small, we conclude that there is a statistical difference between the two models, i.e. that the row and column variables are not independent, which in this case means that there is an association between the measured values for age and gender.
Note that when there is no missing data, the results given by this method will be identical to the maximum likelihood test of independence described in Independence Testing.
Examples Workbook
Click here to download the Excel workbook with the examples described on this webpage.
Links
References
Ehlers, R. (2005) Incomplete contingency tables
No longer available online
Howell, D. (2008) The treatment of missing data
https://www.uvm.edu/~statdhtx/StatPages/Missing_Data/MissingDataFinal.pdf