The Friedman Test data analysis tool can be used to conduct this test, plus a variety of post-hoc tests. E.g. to conduct the analysis for Example 1 of Friedman Test using the data on the left side of Figure 2, press Ctrl-m and select the Analysis of Variance option (or the Anova tab when using the Multipage interface). Next, fill in the dialog box that appears as shown in Figure 1.
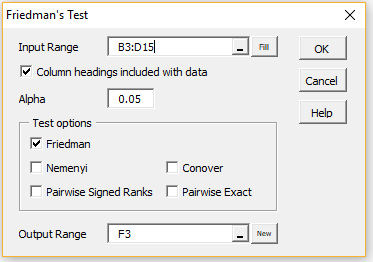
Figure 1 – Friedman Test dialog box
Note that we include the column headings but not column A in the Input Range.
After clicking on the OK button, the output shown in Figure 2 appears.

Figure 2 – Friedman Test results
The p-value = .048668 in cell G9 is based on the chi-square test, while the p-value = .041077 in cell J10 is based on the F test. Note that these tests use the ties correction.
As shown in Figure 1, we can also use the Friedman Test data analysis tool to perform a number of follow-up tests, including the Nemenyi and Conover tests (see Friedman Post-hoc Tests).
Links
Examples Workbook
Click here to download the Excel workbook with the examples described on this webpage.
References
Pereira, D. G., Afonso, A., Medeiros, F. M. (2015) Overview of Friedman’s test and post-hoc analysis
Available through ResearchGate
Demsar, J. (2006) Statistical comparisons of classifiers over multiple data sets. Journal of Machine Learning Research.
https://www.jmlr.org/papers/volume7/demsar06a/demsar06a.pdf
Hello Dr. Charles
I am doing an analysis on my datasheet. I have four measurements on 24 calves and two groups(Treatment and Control). In some parameters data are not in normal distribution(and didn’t normalized).
How can I use Friedman test for one between factor(treatment and control groups) and one within factor(Time of four measurements) ?
Thank you for consideration.
Hello dr. Zaiontzn
I’m working in office2003.
I need to perform a Friedman test with post hoc but I’m not able to find the option in the Ctrl-m menu.
Maybe It is not possible to perform Friedman test by excel 2003?
Thanks so much.
Paolo
Hello Paolo,
Yes, you can do it in Excel. See the following webpage for the details:
https://www.real-statistics.com/anova-repeated-measures/friedman-test/
Charles