Real Statistics Data Analysis Tool: The Real Statistics Resource Pack supplies a Panel Analysis data analysis tool that automates the capabilities described above.
For example, to perform the analysis for Example 1 of Random Effects Model, press Ctrl-m and click on the Time S tab (or double-click on the Time Series option in the dialog box that appears if using the original user interface). Next, select the Panel Analysis option. Finally, fill in the dialog box that appears as shown in Figure 1, and press the OK button.
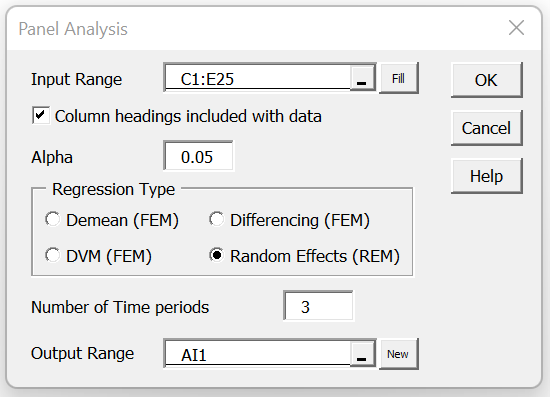
Figure 1 – Panel Analysis dialog box
After clicking on the OK button, the output shown in Figure 1 of xxx appears (without columns AG and AH).
You can perform any of the three Fixed Effects models in the same way.
Note that if you select the Demean (FEM) option in Figure 1, the standard error corrections will be made automatically.
Links
References
Gujarati, D. & Porter, D. (2009) Basic econometrics. 5th Ed. McGraw Hill
http://www.uop.edu.pk/ocontents/gujarati_book.pdf
Hill, R. C., Griffiths, W. E., Lim, G. C. (2018) The principles of econometrics. 5th edition. Wiley.
That incredible Teaching Mechanism that you used, thank you!
Thanks, Maraba,
Glad I could help.
Charles
Hi Charles,
I am currently building my Excel Model with your add-in and, therefore, created a balanced data set over 10 year period. However the original data set is unbalanced. Is it also possible to use the add-in functions in this case? or what parameters do I need to change?
Hi Benedict,
This data analysis tool doesn’t work for unbalanced data. For example, the Input Range in the dialog box in Figure 1 needs to contain a reference to columns A and B so that the appropriate rows can be combined properly. The actual calculations are not very different from those that are presented in this part of the website. I will eventually add this support.
Charles