REM Example
Example 1: Perform regression for the panel data in Figure 1 of Demeaning for Panel Data (repeated on the left side of Figure 1) using the random-effects model.
The first thing we need to do is calculate the transformation parameter theta. To do this, we need to estimate the values of σe2 and σu2.
We can obtain an estimate for σe2 by performing OLS regression without an intercept on the demeaned data, as described in Demeaning for Panel Data. From cell AL13 of Figure 3 of Demeaning for Panel Data, we see that the corrected MSRes = .03778, and so we will use this as our estimate for σe2.
We next estimate σu2 by performing OLS regression including an intercept on the data for the unit means. This is the data in range L1:N9 of Figure 1 of Demeaning for Panel Data (repeated in range T1:V9 of Figure 1). The results are shown on the right side of Figure 1.
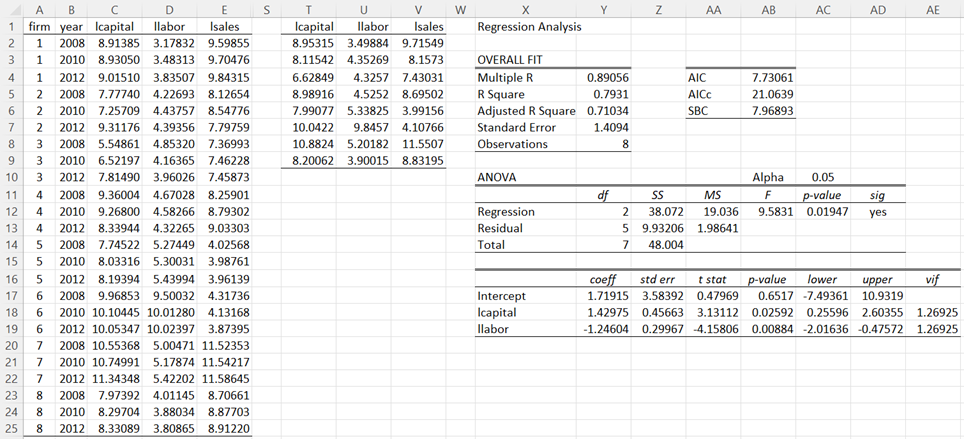
Figure 1 – OLS regression on unit means
We see that MSRes = 1.98641 (cell AA13), and so we estimate that
![]()
It now follows that the transformation parameter is
![]()
as shown in Figure 2.
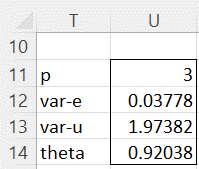
Figure 2 – Transformation parameter
We now perform the regression
![]()
as shown in Figure 3.
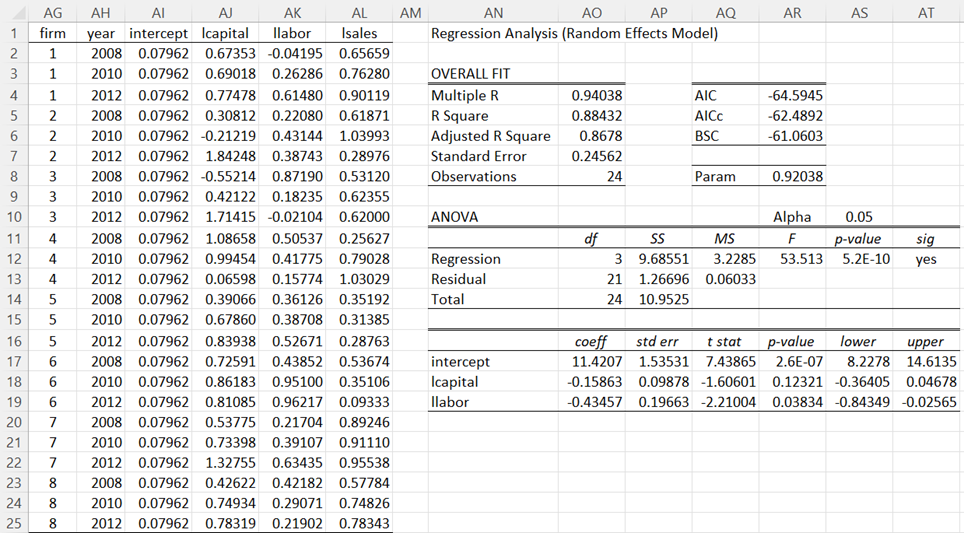
Figure 3 – REM regression
The data on the left side of the figure is created by placing the formula =1-$U$14 in cell AI2, highlighting the range AI2:AI25, and pressing Ctrl-D. Finally, we insert the formula =C2-$U$14*INDEX(T$2:T$9,$AG2,1) in cell AJ2, highlight range AJ2:AL25, and press Ctrl-R and Ctrl-D.
We now perform OLS regression on the data in range AI1:AL25 without an intercept, as shown on the right side of the figure. Here, the intercept is treated just like any regressor.
This time we see that llabor is significant but lcapital is not.
Worksheet Functions
Real Statistics Functions: The Real Statistics Resource Pack provides the following worksheet functions where R1 contains balanced panel data sorted first by unit and then by time period with the data for the dependent variable in the last column (as in columns C, D, and E of Figure 1).
REM_PARAM(R1, periods): returns the transformation parameter for the data in R1 without headings based on the specified number of time periods
PANEL_REM(R1, periods, head): returns an array with the REM data based on the data in R1 and the specified number of time periods: if head = TRUE (default FALSE) then it is assumed that the panel data contains column headings and that these will be used to create column headings for the output.
Thus, we can obtain the values in U14 via the formula =REM_PARAM(C1:E25,3) and the values in range AI1:AL25 via the array formula =PANEL_REM(C1:E25,3,TRUE).
Examples Workbook
Click here to download the Excel workbook with the examples described on this webpage.
Links
References
Gujarati, D. & Porter, D. (2009) Basic econometrics. 5th Ed. McGraw Hill
http://www.uop.edu.pk/ocontents/gujarati_book.pdf
Hill, R. C., Griffiths, W. E., Lim, G. C. (2018) The principles of econometrics. 5th edition. Wiley.
Hi Charles,
Why does the REM tool not make a degrees of freedom adjustment for the number of units as the FEM does? Is this an error of the tool?
Thank you,
Gareth
Hi Charles,
I do have a similar problem. I am executing with Balanced data, Panel Data Analysis and I get #WERT in all cells (results). I did applied =VER() and I did obtained 8.5 Excel 2010/2013/2016/2019/2021/365 Windows. So I think is not the problem. Do you have any Idea what could be?
Regards,
Rómulo
Romulo,
I changed the way I handled TRUE/FALSE (WAHR/FALSCH) in Rel 8.5 which has caused some errors of the type that you are reporting in non-English language versions of Excel. Yesterday, I issued a new release of the Real Statistics software (Rel 8.6) which I hope resolves these types of issues.
I suggest that you download the new release. Hopefully, it resolves the issue. Please let me know if the problem persists. Please use the =VER() formula to make sure that the new release has been installed.
Charles
Hi Charles,
I execute the procedure as instructed, but I still have the same problem. I have the, 8.6 Excel 2010/2013/2016/2019/2021/365 Windows version, but I still get the #WERT mistake, the problem persists,
Rómulo
Romulo,
I understand that you see a #WER error value in cell G1, but what formula do you see on the formula bar when you click on cell G1?
Charles
Hello Charles,
I just changed the newest version (8.6.1) and applied Panel Analysis DEMEAN(FEAM), DVM(FEM), Differencing (FEAM) and Random Effects (REAM) and all of them work perfect now.
I don´t have the #WERT! Mistake and I obtained the statistical figure and results!
Thanks a lot I really appreciate!
Romulo
Hello Charles,
I hope you can help me with another question.
I have read that all statistical properties of RE estimation are asymptotic, and that N should be large and T small for the asymptotic properties of REM to be realised.
Whereas I have understood T to indicate time, the following two scenarios illustrate that T may instead refer to the number of units: in case 1 there there are two observations over time (T = 2) for each unit, and ten units. In case 2, there are four observations over time (T = 4) for each unit, and ten units. Case 1 should therefore stand a better chance of realising the asymptotic properties of RE because T is smaller. However, there are twice the number of observations in the second case (N=40), which I expect will provide for a better estimate.
Should not the number of units then be small and the number of observations large for the asymptotic properties of RE to be fully realised?
Many Thanks,
Gareth
Hello Gareth,
I had always understood that the number of units should be small compared to the number of time periods, but I don’t have much expertise in this area.
Charles
Thank you Charles – it now works perfectly.
Gareth
Hi Charles,
Can the PANEL_REM function be used with unbalanced panel data? Or, as in my case, pooled cross sectional data?
My dataset consists of n0. 48 observations for 21 countries. For two countries there are five observations, for six countries there is only one observation. Observations are scattered over time so that there is no single “period” per se. Would the average of observations per country suffice as the number of periods? (in my case it is 2.8 or so). I have tested the function for this and it provides a sensible output. I would like to know however whether this is methodologically sound?
Many Thanks
Hello Gareth,
The current implementation of PANEL_REM assumes balanced panel data.
Your approach seems reasonable since I don’t think you can do much more given the data you have. If the predictions look good, then I would go with it. Clearly, this approach won’t capture the variability of the data, but you don’t have sufficient observations to do more. Perhaps there are other approaches, but I don’t have a better recommendation.
Charles
Hi Charles, thank you for your response and advice. I have another questions relating to the REM_PARAM function.
Having used this function on one pc (as described above using Office 365) I have attempted to use the same file on another pc (using Office 2016) and found that Excel does not recognise the function (the cell containing the function reads #NAME?). Other functions are recognised however (e.g. StdRegCoeff is recognised).
Do you have any idea why this might be the case? I’ve scoured the real-stats site for troubleshooting info on this and not found anything directly related to this issue.
Thank you,
Gareth
Hello Gareth,
Perhaps the other PC is not running the latest version of the Real Statistics software. What do you see when you enter the formula =VER() in any cell?
Charles
Hi Charles,
I get the following:
7.9.1 Excel 2010/2013/2016/2019/365 Windows
Best Regards,
Gareth
Hi Gareth,
Panel data functions were added in Rel 8.0. Rel 7.9.1 doesn’t have these capabilities. You just need to upgrade to the current release, Rel 8.4.
Charles