Basic Concepts
In Dickey-Fuller Test, we describe the Dickey-Fuller test, which determines whether an AR(1) process has a unit root, i.e. whether it is stationary. We now extend this test to AR(p) processes.
For the AR(1) process
![]()
We take the first difference to obtain the equivalent form
![]()
where Δyi = yi – yi-1 and β = φ – 1, and test the hypothesis
H0: β = 0 (equivalent to φ = 1)
H1: β < 0 (equivalent to φ < 1)
If |φ| = 1, we have what is called a unit root (i.e. the time series is not stationary). We have three versions of the test.
| Type 0 | No constant, no trend | Δyi = β1 yi-1 + εi |
| Type 1 | Constant, no trend | Δyi = β0 + β1 yi-1 + εi |
| Type 2 | Constant and trend | Δyi = β0 + β1 yi-1 + β2 i+ εi |
The extension to AR(p) processes has the following three versions.
| Type 0 | No constant, no trend | |
| Type 1 | Constant, no trend | |
| Type 2 | Constant and trend |
Once you know how many lags to use, the augmented test is identical to the simple Dickey-Fuller test. We can use the Akaike Information Criterion (AIC) or Bayesian Information Criterion (BIC) to determine how many lags to consider, as described in Comparing ARIMA Models.
We can now use the full version of the ADFTEST function that was introduced in Dickey-Fuller Test.
Worksheet Function
Real Statistics Function: The Real Statistics Resource Pack provides the following array function, where R1 contains a column of time series data.
ADFTEST(R1, lab, lag, criteria, type, alpha): returns an 8 × 1 range which contains the following values: tau-statistic, tau-critical, yes/no (stationary or not), AIC value, BIC value, # of lags (p), the first-order autoregression coefficient, and estimated p-value.
If lab = TRUE (default is FALSE), the output consists of an 8 × 2 range whose first column contains labels. type = the test type (0, 1, 2; default is 1). The default value for alpha is .05.
The arguments lag and criteria, which were not used for the Dickey-Fuller Test, are defined as follows:
- lag = the maximum number of lags to use in the test (default 0)
- criteria =
- “none” : no criteria are used, and so p is set to the value of lag
- “aic” : the AIC is used to determine the number of lags p (where p ≤ lag)
- “bic” : the BIC is used to determine the number of lags p (where p ≤ lag)
To specify the criteria, you can use “AIC” or 1 instead of “aic”, you can use “BIC” or 2 instead of “bic”, and you can use “” or 0 instead of “none”.
If lag < 0, then lag will automatically be set to value =Round(12*(n/100)^.25,0), as proposed by Schwert, where n = the number of elements in the time series.
To specify the test type, you can use “” or “none” instead of 0, you can use “drift” or “constant” instead of 1, and you can use “trend” or “both” instead of 2.
Example
Example 1: Determine whether the data in column A of Figure 1 has a unit root based on a model without trend, based on the Schwert estimate for the maximum number of lags using the AIC criterion. Also, determine whether there is a unit root based on a model with trend and a maximum number of lags equal to 7 using the AIC criterion.
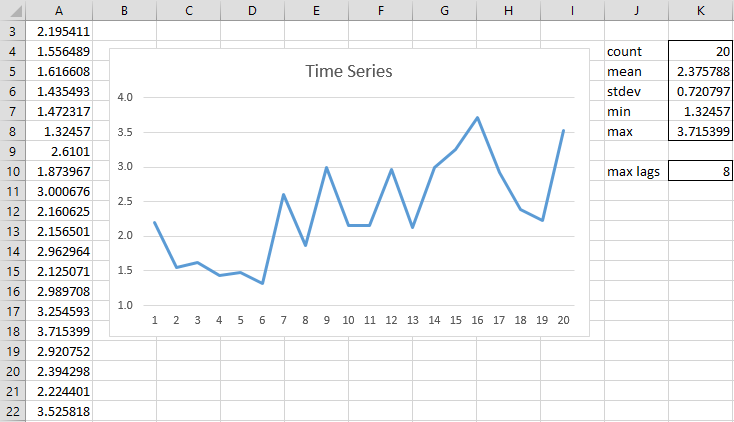
Figure 1 – Time Series
Here, range J4:K8 contains the array formula =DescStats(A3:A22,TRUE). We observe that the mean value of the time series is 2.376, and so we conclude that the time series likely has a non-constant mean. We could confirm this by using a t-test to see whether the population mean is significantly different from zero.
Finally, we use the array formula =ADFTEST(A3:A22,TRUE,-1) to show the results of the ADF test without trend. The -1 means that we are using the Schwert estimate for the maximum number of lags. We are also using the default type = 1, which results in the test for constant without trend. As we can see from range P4:P11 in Figure 2, since tau-stat > tau-crit, the time series is not stationary.
Results
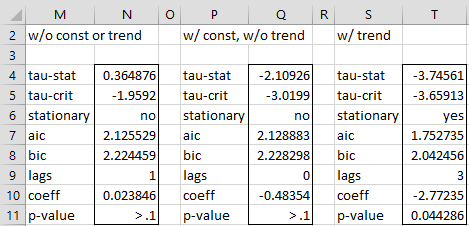
Figure 2 – ADF Test
Note that the above formula effectively uses a maximum lag count of 8, which can be seen by using the formula =ROUND(12*(K4/100)^0.25,0) in cell K10 from Figure 1.
Looking at the table in Figure 1, it appears that the time series has a trend, and so we repeat the ADF Test with constant and trend to get the results shown in range S4:T11 of Figure 2 using the array formula =ADFTEST(A3:A22,TRUE,7,”aic”,2). Here, type = 2 (constant and trend) and the maximum number of lags = 7. Note that we didn’t use 8 as the maximum number of lags since that would produce error values (based on insufficient degrees of freedom in the underlying regression analysis).
Data Analysis Tool
Real Statistics Data Analysis Tool: As explained in Time Series Testing Tools, the Time Series Testing data analysis tool can be used to perform the Dickey-Fuller Test. In fact, it can also be used to perform the Augmented Dickey-Fuller Test.
Links
Examples Workbook
Click here to download the Excel workbook with the examples described on this webpage.
References
Dickey, D. A., Fuller, W A. (1979) Distribution of the estimators for autoregressive time series with unit root. Journal of the American Statistical Association. Vol 74.
https://www.researchgate.net/publication/243644934_Distribution_of_the_Estimators_for_Autoregressive_Time_Series_With_a_Unit_Root
Wikipedia (2016) Augmented Dickey-Fuller test
https://en.wikipedia.org/wiki/Augmented_Dickey%E2%80%93Fuller_test
Minitab (2016) Methods and formulas for Augmented Dickey-Fuller test
https://support.minitab.com/en-us/minitab/help-and-how-to/statistical-modeling/time-series/how-to/augmented-dickey-fuller-test/methods-and-formulas/methods-and-formulas/
Fuller, W. A. (1976). Introduction to statistical time series. New York, Wiley.
Gujarati, D. & Porter, D. (2009) Basic econometrics. 5th Ed. McGraw Hill
http://www.uop.edu.pk/ocontents/gujarati_book.pdf
in case of w/trend,
if,
tau-stat :-3.7456
degree of freedom : 10
p-value is 0.003811225, not 0.044286
am I wrong?
Hello,
You seem to be using the t-distribution, namely T.DIST.2T(ABS(-3.7456),10) = .003811225.
This is not the correct test. tau is not the same as t
Charles
Hello,
That’s another excellent article that brings a lot of knowledge about unit root testing.
I would like some clarification if possible,
1) When to use AIC or BIC? For example, to check the cointegration of pairs of financial market assets, would it be better to use AIC?
2) The Schwert’s formula (=Round(12*(n/100)^.25,0)), as stated in the article, will determine the maximum number of lags, which implies that this is not the optimal lag, and that we should still calculate ADF for lags from 0 to this value until we find the best one? If so, how do we define the best lag? What is the criterion that defines the optimal lag? Does this same logic apply to BIC?
3) If we don’t use the optimal lag, either for AIC or BIC, just using Schwert’s formula, could this cause serious misinterpretations? Or would we just be close to the validation limits, for example we could accept the result for 5% but not for 10%?
Thank you very much!
Hello Gustavo,
I apologize for my delayed response. Hopefully it is not too late to share the following information, but the following link may be helpful to you: https://faculty.washington.edu/ezivot/econ584/notes/unitrootLecture2.pdf
Charles
I get ARMA(2,3) using Akaike criterion. Then should use adf test with p=1, 2 or 3 (in R it is k)?
Sorry Zbych, but I don’t understand your question.
Charles
ADF test has another parameter. Here above it is p. Using ADF test in R the parameter is called k. I have time series data. Putting them into auto.arima I get that the best fitting model is ARMA(2,3). Auto.arima finds a model which minimizes Akaike criterion (a best fitting model in that sense).
Model ARMA(2,3) is not always stationary (it is if the roots of the auto-regressive polynomial are outside unit circle). May I use now ADF test to check if my series is stationary? If yes what parameter p (see above) should I use? The model above with sum of delta y_t I do not recognize. Is it AR(p) or ARMA(1,p)?
Hello Zbych,
Are you saying that the implementation of the ADF test in R has a parameter k that is omitted from the Real Statistics implementation? What is the definition of k?
Charles
Ok. After some calculations I see that the model above is AR(p) (as you wrote). So in my data I should use ADF test with p=2. By the way the test is checking only one root but if we have AR(p) the auto-regressive polynomial has p complex roots. The test ADF is checking if one of the roots are outside unit circle. For p=0 (DF test) there is one root of the polynomial (stationary if and only if roots |z|>1 that is the coefficient before y_{t-1} between is -1 and 1). Then I catch the sense of DF test. For ADF test (p>1) is a bit strange.
Correction. In my data where I have ARMA(2,3) I should use p=1.
Best regards
Perhaps my older post was verbose(it’s really not for a page but for a section,u probably prefer to remove it) .In order to keep focus on ADF i rearranged it a bit:
1)When peforming ADF to check for stationarity of residuals , how do we choose type?Would it be wise to start with type 2 (trend+constand) as the general case?If not, how to decide?
2)I’ve read that if a test has unit roots it’s differenced data are stationary.From here i concluded that if DF says stationary, we are good to go!
3)Next is differences ?Does ADF provide assistance to choose wether it is needed and how many of them are better
4)In a regression (of two time-series) do we need DF or ADF
Hello Savvas,
1) I suggest that you create a graph of the data and decide based on the graph
2) This is correct for a DF test. After an ADF test, you might need to perform differencing multiple times.
3) Not sure what you are asking. Do you want to know how many times to perform differencing?
4) I don’t understand what you mean by regression of two time series.
Charles
In a book I’ve been reading it was mentioned that in the case of two time-series the RSquare might be artificially high since they could just be trending with time. In it three tools were mentioned
A)use a time-period column on the independants
B)de-trend them (and do regression with the residuals)
C)difference (and it mentions different types of difference :level,seasonal and the simplest from previous period)
In what order and how many times should these be used?…is the question
And in the other hand in two time series regression in chapter 12 it mentioned different perhaps more relaxed set of assumptions i am seeking to use.Like have an full-blown example with at least one(or as little as needed sometimes) test per assumption .
And something new i have been trying to understand through your site is co-integration!!!!!!Is it more powerfull than correlation?Does it have assumptions?How do you report artefacts after anlaysis.
forgot D) you can also perform a box-cox transformation in the dependant and\or the independant variables.
I am seeking to find the order to use these tools so badly, it distracts me from developing.
Again thnx charles, your site is the best
See the following webpage for an explanation of this approach:
https://real-statistics.com/correlation/box-cox-transformation/
Charles
Hello Savvas,
I am not completely sure what you are referring to in A, B, C, but most likely you are trying to eliminate autocorrelation.
E.g. C is used to create a stationary time series. This is described at https://real-statistics.com/time-series-analysis/arima-processes/arima-differencing/
The following webpage deals with A: https://real-statistics.com/multiple-regression/multiple-regression-analysis/seasonal-regression-forecasts/
You probably don’t need to use all three of these approaches, and so I am not sure there is an order. You just need to use an approach that addresses the issue you are trying to resolve. I still need to look at the book that you sent me a link to in your email to me. This will help me better understand your questions.
Charles
Hi, charles
i always want to complement your site since ,at the minimum, i will get the leads i want to my searches.Now i am trying to report a trend coefficient for a single regression among two time series as a feature of my spreadsheets with activities that are extended to have kept variables\indicators.I only intend to hint them to further research!
I am struggling to put an alogithm in line…i figured that i have to use stationarity and test for normality from the other assumptions.(the other are easier orrrrr…..not?)
I also discovered that if the data are simultanously trending i need to use their differences as used in finance .If *they* are stationary which is described by an ADF i can move on but how many differences should that involve and should i use type 2 by default?,as the general case?.On the other hand, I found out that you can use the residuals from both variables and their trends in time(Wooldridge) if their co-trending produces artificially high R^2.I also used to loop throught transformations to get the best stats.Now i think i will just find the best box-cox lambda.
1)But as i said i struggle to put these in order(or eliminate something from the procedure) and how should they are reverse-transformed to the units of the inputs to the model!
2)I have sent you an e-mail where i extend my questions since they do not fit on one page but rather on a section . There is also an offer you can’t neglect
Thnx in advance
See my response to your later comment.
Charles
Hi Charles
Concerning your figure 2, how can I know which of the results (no constant no trend/ constant no trend/ with trend) I have to chose? For the trend I plot the data and look if there is a trend but what can I do to know if I have to chose with or without constant?
Best regards
Alexander
Hi Alexander,
It is a good question. See the following webpage for further information
https://stats.stackexchange.com/questions/77175/unit-root-tests-how-to-decide-if-to-include-a-trend-and-or-a-constant
Charles
Thank you Charles!
I know now which result I have to chose but I have a question concerning the criteria I have to enter in your excel formula. Using “AIC” or “BIC” as a criteria the number of lags which will be shown after using your ADFTEST formula will be the number of lags which maximise the AIC and BIC Value correct?
And how is the number of lags calculated when I use “none” as a criteria? I don’t get what the “p” means. Is it the number of lags which maximises the p-value?
Thank you so much for help.
Alexander
Hi Charles,
I have a question concerning the output “lags” after using your your ADFTEST formula and entering “none” as a criteria. How does it calculate the optimal number of lags to use like for instance in your example here in Figure 2 column T the lags: 3.
How does the model know this is the optimal number of lags?
Best regards
RJ
Hi RJ,
If “none” is chosen then the number of lags that you specify is used.
If you want the ADFTEST function to choose the number of lags, then you should specify the schwert option.
Charles
Hi Charles,
Thank you. So your formula above =ADFTEST(A3:A22,TRUE,7,”aic”,2) means it chooses the number of lags which gives us the highest aic value with a max value of 7 lags correct?
Best regards
RJ
Hi RJ,
I believe that is correct.
Charles
Hi Charles
Thank you, I detected the error, I did the =adftest formula but I forgot to put -1 after the “True”.
Now I get one time series with lags=7 and the other with lags = 0. When I do the granger test wanting to know if the time series (with lags = 0) predicts the other time series (with lags=7). Looking at the granger test result, will I have to look at the result with 7 lags (or in my case 8 as its differenced data) or 0 (meaning 1 as its differenced data too)?
Greg
Hi Greg,
Probably you can use lags 1, but see
https://www.real-statistics.com/time-series-analysis/time-series-miscellaneous/granger-causality/
Charles
Hi Charles,
At first my data wasnt stationary and I applied first differences. Now it is stationary but the ADF Test shows me lags: 0
Does that mean that the optimal number of lags is 0 and therefore I cant perform the granger causality test? Or how exactly do I see the lags I can use?
Thank you so much for your help and best regards
Greg
Hi Greg,
When the ADF test shows lags 0 is this on the original data or the differenced data?
Charles
Hi Charles
It is on the differenced data.
Best regards
Greg
Greg,
Lag 0 on the differenced data is equivalent to lag 1 on the original data.
What results do you get from the ADF test on the original data?
Charles
Hi Charles,
Did it on different samples, but mostly 0 on the original data too.
And also for the granger test, when I compare one time series to another, is it important that doing the adf test before on each time series it shows the same number of lags?
Greg
Hello Greg,
I’ll look into why the lags are the same before and after differencing. This doesn’t seem correct.
Charles
Hi Charles,
I did a ADFTest and got the result that it is stationary but lags=0.
What does that mean for performing the granger causality test? That I cant use it as lags of 0 doesnt work?
I have a dataset of 64 and when I just use the Round formula I get a max lag of 11 which is quite disturbing.
Any other suggestions how I can get the max of lag to use?
Thanks in advance for your help!
Best regards
Greg
hi research professor, I am a sierra leonean pursuing BSc economics at nNjala university Bo. I am currently writing my dissertation on the topic the impact of global petroleum price on key macroeconomics variables in sierra leone. but i have been constrained as to how to run my regression the variables i have selected, so please sir i really want you to help me out as the econometrics we did is traditional and not up to standard.
Hello Abubakar,
I am happy to answer specific questions that you have.
Charles
When I use the ADF Test, I keep getting stationary as “undef” instead of yes or no. What could be the reason for that
This means that the test is inconclusive.
Charles
Hey I am trying to understand how the RegCoeff function works when doing the multiple linear regression. I know the values from this are used to determine the ADF crit value value but I am nor sure how RegCoeff is calculating the four value is produces. Can you please let me know the formula that you used for this function? Thanks in advance
Hi Joe,
See https://www.real-statistics.com/multiple-regression/multiple-regression-analysis/
and especially
https://www.real-statistics.com/multiple-regression/multiple-regression-analysis/real-statistics-capabilities-for-multiple-regression/
Charles
Dear Charles,
I used Engle-Granger Test in order to see how the gas prices in Germany are cointegrated with prices from other European countries (trading hubs). Indeed, they are, but my question is how can I see if German prices are “more cointegrated” with a specific country? Is it possible? I want to understand what country has the biggest influence.
Thank you in advance,
Artemis
Artemis,
How do you plan to measure “more cointegrated”?
Did you try to use this approach for a couple of countries?
Charles
Hi,
Could you please explain a bit more the reason for using 7 lags instead of 8? Should I decrease the number of lags for each variation of the test (w/trend;w/constant,w/o trend and w/o constant or trend)?
Thank you in advance.
I am looking forward to your reply,
Marina
Hi Marina,
The value 8 in cell K10 is calculated by the formula =ROUND(12*(K4/100)^0.25,0), which is the Schwert estimate of the maximum lag.
As explained on the webpage, you can’t actually use 8 for this example since it would produce an error. See the following sentence towards the end of the ewebpage:
“Note that we didn’t use 8 as the maximum number of lags since that would produce error values (based on insufficient degrees of freedom in the underlying regression analysis).”
Charles
The question is why that would produce error values for this example and why there would be insufficient degrees of freedom in the underlying regression analysis if we use lag of 8, but no problem if we use lag of 7 ?
Also, considering that one can use AIC criteria to determine the optimal lag number as in the example, does it matter what is the max. lag (7 or 8) if AIC criteria returns any number below 7 ?
I apologize for my delayed response. Hopefully it is not too late to share the following information, but the following link may be helpful to you: https://faculty.washington.edu/ezivot/econ584/notes/unitrootLecture2.pdf
Charles
Hi
My data is stationary after difference once, but the lags of the data are fifteen, what do high lags mean, and if the lags are high, can I do exponential smoothing?
Dustin,
What do you mean by the lags of the data are 15?
You can always do exponential smoothing.
Charles
Hi
what is the implication of lag? In your chicken-egg example, egg Granger causes chicken at lag 1,2,3& 4. What do you interpret out of it in time series? Help me understand the interpretation please!
Amit,
Are you asking for the definition of Lag or are you asking about something else?
Charles
Hi,
Thanks for the prompt response. You can please share the definition of lag with respect to time series. What inference should I draw from the arrived values of lag(m) in the egg-chicken example?
Amit,
The lag is the number of differencings made to a time series as described at
https://www.real-statistics.com/time-series-analysis/stochastic-processes/stationary-process/
Often this is done to convert a non-stationary time series into a stationary time series.
E.g. egg Granger causes chicken at lag 2 means egg* Granger causes chicken* where egg* is the egg time series twice differenced and chicken* is the chicken time series twice differenced.
I don’t find the concept of Granger causation very intuitive, but I do understand what it means as described at
https://www.real-statistics.com/time-series-analysis/time-series-miscellaneous/granger-causality/
Charles
Hi,
Why in the ARIMA model with one difference, you do not add the constant for calculation of residuals. For example in an AR(1) model the residuals are calculated as
y_t – phi1*y_t-1 So not constant
Fabricio,
If you are referring to the AR(1) and other ARIMA models described on the website, I usually subtract the constant term from the data and so deal with a time series without a constant term.
Charles
Charles,
Based on the example in figure 2, I have a series where 3 scenarios have been evaluated. of these 3 scenarios, 2 of them are evaluated as non-stationary and 1 as stationary (random walk + drift + trend). Correct me if I am wrong: this scenario has a deterministic trend and is stationary in lag 3, while in the two scenarios that are not stationary they are in lag 1 and lag 0. At the end of this series first ask: Is it absolutely stationary or not ???, second question: the test also detects seasonality?
Pedro,
I don’t fully understand your first question. Are you referring to some example on the Real Statistics website or an example that you have. IN the latter, I would need to see the data.
Regarding your second question, ADF is not used to detect seasonality. A time series with seasonality is not stationary. The following describes various tests for seasonality
https://www.researchgate.net/publication/309690508_Some_Tests_for_Seasonality_in_Time_Series_Data
Charles
Excellent examples. Thank you. I’ve read a few of your postings and they are all helpful.
The ADF TEST using the Schwert, AIC and BIC or NONE criteria, how do I conclude if my time series is stationary or not? Or in the results when I get that it is stationary with lags = 0, what does it mean that it is stationary with that lag?
Pedro,
A significant result means that the time series is stationary (see for example Figure 2).
I will address the other part of your question shortly.
Charles
ok. thanks.
Pedro,
Sorry for the delayed response.
If t-stat < t-crit the time series is stationary. If lags = 0 then you are using the Dickey-Fuller Test. See https://www.real-statistics.com/time-series-analysis/stochastic-processes/dickey-fuller-test/
Charles
ADF test just gives me a value saying “Tau”, Descstats just returns “Count”. How do I get the values?
The ADF test uses what Excel calls an array function. See the following webpage for how to use an array function so that you get the rest of the output:
Array Formulas and Functions
Charles
Yes now I understood. THank you so much ! Also, how do we determine which type of test- type-1 , type-2, type-0 to choose from.
Akhil,
You can graph the data and see whether there is a trend and/or constant. You also may know from previous experience or based on theoretical knowledge.
Charles
Is it possible to run the SADF tests on excel?
SADF is not supported by Real Statistics. I don’t know where you can find this capability in Excel.
Charles
Hi Charles,
The tool you have shared is great. I am using it to find the p-value of residuals obtained by regression of two series. But I am not getting an exact p-value. It gives p>0.1 as a result. Please help me get the exact value.
Hello Anup,
The table of critical values that I am using doesn’t provide values larger than .1 and so I am unable to give an exact value.
Charles
For pair trading of two stocks, which variables of ADF test be chosen- w/o trend and constant or w/ constant and no trend or w/ constant and trend
It depends on what your data looks like.
Charles
Hi,
How to calculate p_value using ADF test?. Please let me know the parameters to select in the plugin.
Thanks,
Nesamani
Nesamani,
The ADFTEST function calculates an estimate of the p-value for you. Regarding the parameter values to use, this depends on which version of the test you want to employ.
Charles
Thank you Charles.
I am getting result of ADF test for time series residuals per below:
criteria schwert
drift no
trend no
lag 14
alpha 0.05
tau-stat -2.232199336
tau-crit -1.94129
stationary yes
aic 7.802771324
bic 7.819320594
lags 0
I cannot find P_Value in the result. Please help me.
Nesamani,
If you use the ADFTEST function, just make sure that you insert your ADFTEST formula in an 8 x 2 sized range.
If instead you used the data analysis tool, the allocated range is incorrectly set to a 6 x 2 size, which is too small. This is easy to fix. Just highlight the 6 x 2 range containing the ADFTEST formula and expand this range to an 8 x 2 size (by highlighting another two rows). Now click on the ADFTEST formula in the formula bar and press Ctrl-Shft-Enter. This will add the missing two rows, the last of which contains the p-value.
I will fix this error in the next release of the Real Statistics software (available soon).
Thanks for finding this error. I appreciate your help in improving the software.
Charles
Thank you Charles. It is working now.