The Fligner-Killeen test is a non-parametric test for homogeneity of group variances based on ranks. It is useful when the data are non-normal or where there are outliers. We present the median-centering version of this test.
Example
Example 1: Use the Fligner-Killeen test to determine whether the 4 samples in range B3:E11 of Figure 1 have significantly different population variances.
The test starts like the median-centering version of Levene’s Test by calculating the absolute values of the residuals from the group medians, as shown in range G3:J11 of Figure 1. E.g. the residual in cell G4 is calculated using the formula =ABS(B4-B$12).
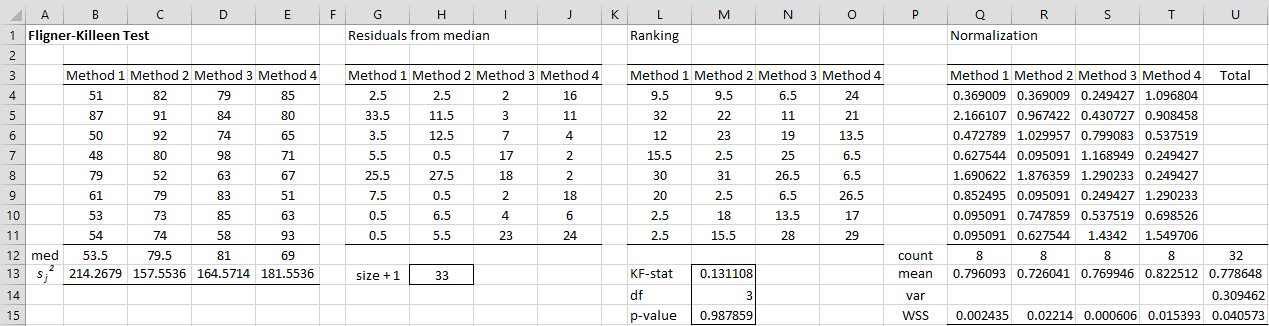
Figure 1 – Fligner-Killeen Test
Calculating ranks
Next, all these residuals are ranked, with the results shown in range K3:O11. E.g. the ranking in cell K4 is calculated by the formula =RANK.AVG(G4,$G$4:$J$11,1), or optionally in Excel 2007 by the Real Statistics formula =RANK_AVG(G4,$G$4:$J$11,1).
The next step is to normalize these rankings (range Q3:T11) as was done to create the QQ plots. E.g. the value in cell Q4 is calculated by the formula =NORM.S.INV((L4/$H$13+1)/2), where cell H13 contains the number of data elements + 1 as calculated by the formula =COUNT(B4:E11)+1.
Calculating the FK statistic
We now calculate the Fligner-Killeen statistic using the formula
![]()
where k = the number of groups, nj = the size of the jth group, aj-bar is the mean of the normalization values for the jth group, a-bar is the mean of all the normalization values, and s2 is the variance of all the normalization values.
For our example, k = 4. The nj values are shown in range Q12:T13; e.g. n1 = 8 as calculated by the formula =COUNT(Q4:Q11). The aj-bar values are shown in range Q13:T13; e.g. mean a1 = .796 as calculated by the formula =AVERAGE(Q4:Q11). The value of the overall mean a-bar is .779 (cell U13) as calculated by =AVERAGE(Q4:T11). The value of s2 = .309 (cell U14).
The weighted sum of the squares (WSSj) is shown in range Q15:T15. E.g. WSS1 = .002435 as calculated by =Q12*(Q13-$U$13)^2. The sum of the WSSj is shown in cell U15. The FK statistic is .1311 (cell M13) as calculated by the formula =U15/U14.
Calculating the p-value
The p-value of the test is .988 (cell M15) as calculated by the formula
=CHISQ.DIST.RT(M13,M14)
where cell M14 contains df, which is calculated by =COUNTA(Q3:T3)-1. Since p-value = .988 > .05 = α, we cannot reject the null hypothesis that the group variances are equal.
Worksheet Function
Real Statistics Function: The Real Statistics Resource Pack provides the following function.
FKTEST(R1) = p-value of the Fligner-Killeen test on the data in range R1
For Example 1, we see that FKTEST(B4:E11) = .988.
Links
Examples Workbook
Click here to download the Excel workbook with the examples described on this webpage.
References
Hitchcock, D. (2017) Test about several variances. Nonparametric statistics
https://people.stat.sc.edu/hitchcock/notes518fall13sec53filledin.pdf
Conover, W. J., Johnson, M. E., Johnson, M. M. (1981) A comparative study of tests for homogeneity of variances, with applications to the outer continental shelf bidding data. Technometrics, 23(4), 351-361.
http://staff.ustc.edu.cn/~zwp/teach/nonpar/Test%20for%20homogeneity%20of%20variances.pdf
Thank you very much!
I wanted to do it ‘manual’ without functions and dind’t find any concrete sources.
Your example helped a lot!
Thank you, Markus.
Glad I could help.
Charles
Please help me, how to the calculated value of cell U14?
This cell contains the formula =VAR.S(Q4:T11)
Charles
Is the Fligner-Killeen test a test for differences in variance between two samples, or a test for differences in coefficients of variation between the samples, as it seems to be going by the given test statistic?
Yours is an interesting observation but, in any case, I have always understood this to be a test of differences in variance.
Charles
When would one use the Fligner-Killeen test? If you have non parametric test such as Kruskal-Wallis, Friedman, or Scheirer-Ray Hare, when would it be necessary to use Fligner-Killeen?
I understand homoscedascity test such as Brown-Forsythe can work with Anova (when run) if the Levene’s test is significant. How would F-K test be applicable?
It can be used instead of Levene’s test, esp. when there are outliers.
Charles
Hi Charles,
First thanks for all your hard work here, super useful.
My question, Does Fligner-Killeen assume independence of samples. If so is there a “paired” sample version?
Thanks again – MAtthew
Hello Matthew,
What would such a paired version test? Why would you need such a test?
Charles
Charles,
honestly I don’t have a particular use case I was really just curious. So theoretically how about a longitudinal study on a group of students measured at three points in their school careers for some non-normal characteristic.
Matthew,
I don’t know of a paired sample version.
Charles
I have downloaded and installed the Real statistics resource pack for excel but I cannot find the FKTEST(R1) function.
Can you please tell me where I should find it?
Thanks!
Andrea,
Just enter the function just like any other Excel function. You won’t find it among the data analysis tools since it is a function.
Charles
Thanks it worked.
Is it possible to get also the exemplifying excel sheet that is displayed as Figure 1 in this page?
Thanks a lot
Worksheets for all the examples can be found at
Examples Workbooks
Charles
Hi Dr. Zaiontz,
I thought of another question, and I hope you can enlighten me a bit. It may be a matter of semantics, but I’m interested in the answer. Both the Fligner Killeen and Kruskal Wallis tests are considered non-parametric methods because they are based on ranks of the data, which are obviously not normally distributed. However, both the FK and KW test statistics are evaluated against the chi-square, which I always thought was a distribution in and of itself. So, if the FK and KW are non-parametric, is the chi-square test considered a non-parametric test too? If we take the word “non-parametric” to imply “distribution-free,” not just a lack of normality, then isn’t it a bit of an error to call the chi-square or any test that uses its distribution a truly non-parametric test, even if such a test does use ranks? Just curious as to your thoughts on this.
Thanks very much!
Kevin Bluxome
Kevin,
I agree with you. Many, probably most, of the non-parametric in the end use some parametric distribution. The data itself doesn’t follow this distribution, but in some way you can think of ranking as a “transformation” which does follow a parametric distribution. Of course these “transformations” are not reversible, which may be why these tests are considered to be non-parametric.
Also when you say that the “ranks of the data…are obviously not normally distributed”, this is not completely correct. The ranks are used since some formula (i.e. transformation) based on them is normally distributed (even if the original was not normally distributed).
Charles
That’s interesting! Please forgive my ignorance, but I guess I’m a little confused as to how a rank transformation could be normally distributed. If the transformed values took on the form of ranks ranging from (1,2,3…n), with each value occurring once assuming there are no ties, I guess that could be seen as a uniform distribution, but I wasn’t aware that those could be considered normal. They don’t have the bell shaped curve that a normal distribution would have, it would look more like a rectangle. Perhaps I’m missing something? Thanks for your patience and for helping me gain a deeper understanding!
Hi Charles,
This is Kevin again. I was just curious – the section said we are using the “median-centering” version of this test. This makes sense from the calculations…but does that imply there are other “versions” of the Fligner Killeen test, like a “mean centering,” etc? Or is there really only this one form of the test that focuses on the median? Thanks for all you do here on the site!
Kevin,
I don’t know of another version of the test, although there may be others.
Charles
Just a quick typo. Soon after the formula for the FK statistic, it says, “The weighted sum of the squares (WSSj) are shown in range Q15:T15. E.g. WSS1 = .00435”
The number should be .002435 — it is correct in the table, but missing the 2 in the text.
Chris,
Thanks for catching the typing mistake. I really appreciate when people such as yourself identify such mistakes. It helps me make the website and other resources more accurate and useful to the everyone else.
Thanks again.
Charles
Thanks again, Charles. I stuck with it and finally figured it out…after the normalization process, the rest is easy! Keep up the great work on the site!
Hi Charles,
Thanks for this raw data example! It’s so much more concrete! I’m following it all the way up to the normalization part…how does the rank value of 9.5 correspond to 0.369009? Is that a z score formed from subtracting the column mean rank from 9.5 and dividing by the SD of the column ranks? If not, what process is involved? I tried using an inverse normal app on my calculator using the formulas given and couldn’t get the numbers to match. Also, to get the value to plug into the inverse normal in Excel, it looks like the formula says to divide the rank by H13 plus 1, but doesn’t H13 already have one more than the total sample size? And why divide by 2?
Thanks for bearing with me…I like to be able to truly understand these things, so I like to do them by hand to get a better feel for what’s going on. Anyone can plug and chug into a formula! Thanks for your time and clarification!
Kevin
Kevin,
The formula used is =NORMSINV((L4/$H$13+1)/2), which just means take the ranking divide by 33 and add 1 to the result and then divide this by 2. The idea is to associate the rankings from 0 to 33 with standard normal values from z = .5 to z = 1. I’m not sure why the test uses these values.
Charles