Worksheet Functions
Real Statistics Functions: The Real Statistics Resource Pack contains the following array functions.
Design2k(k, lab, d): returns a 2^k design including d-way interactions (d = 0, 2, 3; default = 2); output contains 2^k rows when lab = FALSE (default) and k columns if d = 0 or d + C(k,2) columns if d = 2 or d + C(k,2) + C(k,3) columns if d = 3; values consist of only -1 and +1; if lab = TRUE then an extra row of labels is appended to the output.
ExpandDesign2k(R1, d): returns a 2^k design with headings, including d-way interactions (d = 2, 3; default = 2); output is the same as Design2k(k, TRUE, d), except that the first k columns consist of the values in range R1 (which contains only values 1 and -1, without headings).
Effect2k(R1, R2, lab, d): returns a column array consisting of the effect size values for the design described by R1 and R2, where R1 contains the +1 and +1 values (such as range A4:C11 of Figure 1 and R2 contains the data values (such as range D4:G11 of Figure 1); if lab = TRUE (default FALSE), then an extra column is appended with factor labels.
SS2k(R1, R2, lab, d): returns an array consisting of the SS values for the design defined by R1 and R2, exactly as for Effect2k, except that SS values are output instead of effect sizes.
Data Analysis Tool
Real Statistics Data Analysis Tool: The Real Statistics Resource Pack provides the 2^k Factorial Design data analysis tool, which automates the steps described above. We show how to use this tool for Example 1 of 2^k Factorial Design Basic Concepts.
Press Ctrl-m (or an equivalent) and choose the ANOVA option from the original interface or the Anova tab from the multipage interface. Now choose the 2^k Factorial Design option and fill in the dialog box that appears as shown in Figure 1. Note that the row headings are not included in the Input Range.
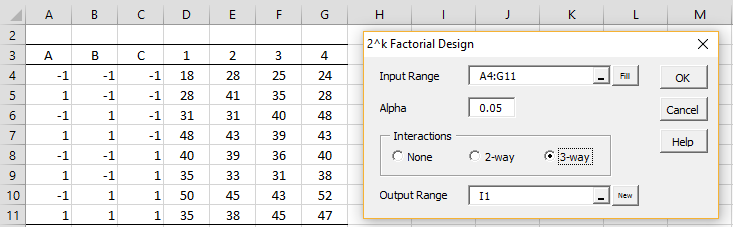
Figure 1 – 2^k Factorial Design dialog box
Upon pressing the OK button, the output in Figure 2 is displayed.
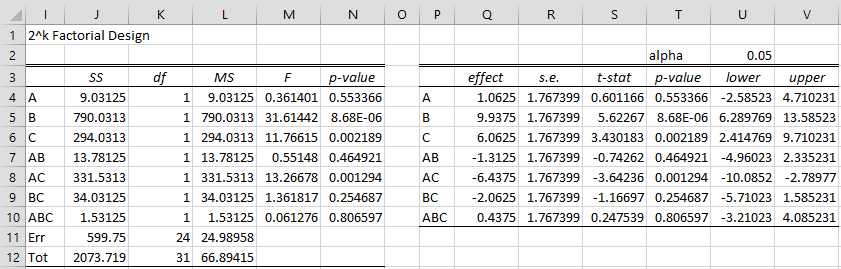
Figure 2 – 2^k Factorial Design data analysis tool
Note that if you had inserted the range A4:D11 in the Input Range in Figure 1 (and so there would only be one column of data), you couldn’t select the 3-way Interaction option, since this would force the error terms (in cells J11 and K11) to be zero.
Range I4:J12 of Figure 2 contains the array formula =SS2k(A4:C11,D4:G11,TRUE,3). Similarly, range P4:Q10 contains the array formula =Effect2k(A4:C11,D4:G11,TRUE,3).
If instead of entering a range in the Input Range, you enter an integer between 2 and 20, then a design table would be output instead. E.g. if you enter the integer 4 in the Input Range and select the 3-way option for the Interactions, the output is as shown in Figure 3.
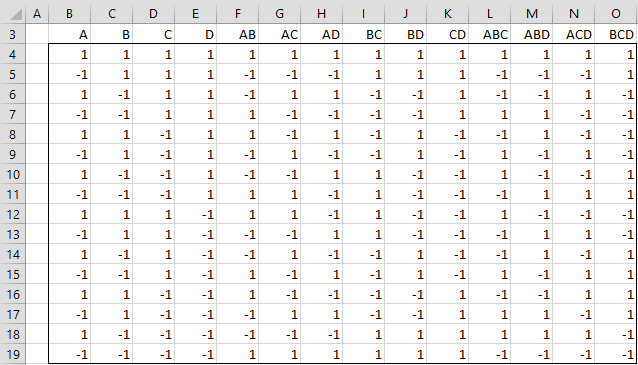
Figure 3 – 2^4 Design
Note that range B3:O19 contains the array formula =Design2k(4,TRUE,3). Finally, note that the output from the formula =ExpandDesign2k(A4:C11,2) where the range A4:C11 is as shown in Figure 4.

Figure 4 – ExpandDesign2k formula
Links
Examples Workbook
Click here to download the Excel workbook with the examples described on this webpage.
References
PennState (2017) The 2k factorial design
https://online.stat.psu.edu/stat503/lesson/6
Montgomery, D. C. (2012) The 2k factorial design. Design and analysis of experiments, 8th ed.
https://faculty.ksu.edu.sa/sites/default/files/douglas_c._montgomery-design_and_analysis_of_experiments-wiley_2012_edition_8.pdf
Hello! I have some trouble trying to make an analysis with 5 factor and 3 datasets. If I eliminate one factor (leaving 4 factors and 3 datasets) it works really well. Is there a reason for this? I think it’s possible to solve this since it’s a workbook problem, but cannot add this extra factor to make it work.
Hello Daniel,
I just tried it and it seemed to work for me, but I may not have tried the same situation as you.
Did you include 2-way or 3-way interactions?
Can you you email me an Excel spreadsheet with your data and results?
Charles
hello,
I can’t use 2^k Factorial Design because each time it gives me an error that I can’t have negative numbers in the input range. But I’m using your table that you gave as an example. what should I do?
thank you
Hi Aveen,
If you email me an Excel file with your data and results, I will try to figure out what is going wrong.
Charles
Hi,
I sent you an email with a photo of the error.
Thank you very much.
Hello Aveen,
I have received your email, and will respond shortly.
Charles
Hello,
thank you.
Hi sir my resource toolpack cannot be applied on my excel
Why not?
Sir may I ask if, what is the formula of this given you example here I mean the 2k factorial, or may I ask sir where is the criteria, I apologized for my bad grammar
Hi Rafel,
The formulas can be found at https://www.real-statistics.com/design-of-experiments/2k-factorial-design/2k-factorial-design-basic-concepts/
Charles
sir hello its me again can i ask you, what is the difference between 3 way and 2 way 2k factorial, because its like anova, WHEN should i use 3 way and also 2 way 2k factorial
Hi Rafael,
3-way Anova provides analysis for 3 factors. I don’t know what you mean by 2-way 2^k factor analysis. A 2^k design is a k-way Anova where each factor has 2 levels. Thus, 2^3 design is a 3-way Anova where each factor has exactly two levels.
Charles
is the factor you’re referring too is -1 -1 -1 ? so if i use
1 -1 -1
3 way factorial that means or it depends on how many factor should i calculate sir?
Hello Rafael,
The factors are A, B, and C.
Charles
and i apologize because i’m basing on what’s on the example
Hi, I have a problem because there is no 2k factorial tool on my excel only ANOVA two way and one way, what should I
do?
Hi Rafael,
It looks like you are using the standard Excel Toolpak. To perform 2k factorial analysis, you need to use the Real Statistics add-in. It is free and you can download it and install it by going to https://www.real-statistics.com/free-download/real-statistics-resource-pack/
Charles
Good morning Charles
I design an experiment in which there will be 3 variables. Due to the non-linear behavior of the process, I need to introduce a central point between the minimum and maximum. How can I do it in real statistic? How to code variables. I know that min = -1, max = 1, but what about the value in the middle?
Hello Piotr,
Do you have any other information? Does the variable follow some distribution?
Charles
I don’t know the distribution of these variables. I only test corner points (min and max). I want to use a tool that will allow me to create a nonlinear model. It’s about something like described in the minitab blog: https://blog.minitab.com/en/michelle-paret/doe-center-points-what-they-are-why-theyre-useful
Hi Piotr,
As the Mintab webpage shows, you need to know something about the data in order to provide a midpoint. What other information do you have besides the min and max points?
Charles
hello,,
i need to imply 2 k-p (2 power k-p) fractional factorial design using Excel ..
if you have any example
best regards
See Fractional 2^k Design
Charles
Dear Charles,
The figure 4 (end) of 2^k factorial design tool does not
appear.
Thanks for all
Mohamed
Mohamed,
Thanks for bringing this to my attention. I can see that the figure doesn’t display, but I still haven’t been able to fix it. I will try again shortly.
Charles
Dear Charles,
Thanks
Mohamed
Mohamed,
I have just fixed the image.
Charles