Basic Concepts
The Mann-Whitney U test is essentially an alternative form of the Wilcoxon Rank-Sum test for independent samples and is completely equivalent.
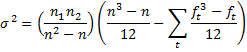
Define the following test statistics for samples 1 and 2, where n1 is the size of sample 1, n2 is the size of sample 2, R1 is the adjusted rank-sum for sample 1, and R2 is the adjusted rank-sum of sample 2. It doesn’t matter which sample is bigger.
![]()
![]()
As for the Wilcoxon version of the test, if the observed value of U is < Ucrit, then the test is significant (at the α level), i.e. we reject the null hypothesis. The values of Ucrit for α = .05 (two-tailed) are given in the Mann-Whitney Tables.
Example using the table of critical values
Example 1: Repeat Example 1 of the Wilcoxon Rank Sum Test using the Mann-Whitney U test.

Figure 1 – Mann-Whitney U Test
Since R1 = 117.5 and R2 = 158.5, we can calculate U1 and U2 to get U = 39.5. Next, we look up in the Mann-Whitney Tables for n1 = 12 and n2 = 11 to get Ucrit = 33. Since 33 < 39.5, we cannot reject the null hypothesis at α = .05 level of significance.
Properties
Property 1:
![]()
Property 2: For n1 and n2 large enough the U statistic is approximately normal N(μ, σ2) where
![]()
Observation: Click here for proofs of Properties 1 and 2.
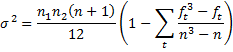
Property 3: Where there are a number of ties, the following revised version of the variance gives better results:
where n = n1 + n2, t varies over the set of tied ranks, and ft is the number of times (i.e. frequency) the rank t appears. An equivalent formula is
 Continuity Correction
A further complication is that it is often desirable to account for the fact that we are approximating a discrete distribution via a continuous one by applying a continuity correction. This is done by using a z-score of
![]()
instead of the same formula without the .5 continuity correction factor.
Example using a normal approximation
Example 2: Repeat Example 2 of the Wilcoxon Rank Sum Test using the Mann-Whitney U test.
Figure 2 shows the results of the one-tailed test (without using a ties correction). Column W displays the formulas used in column T.
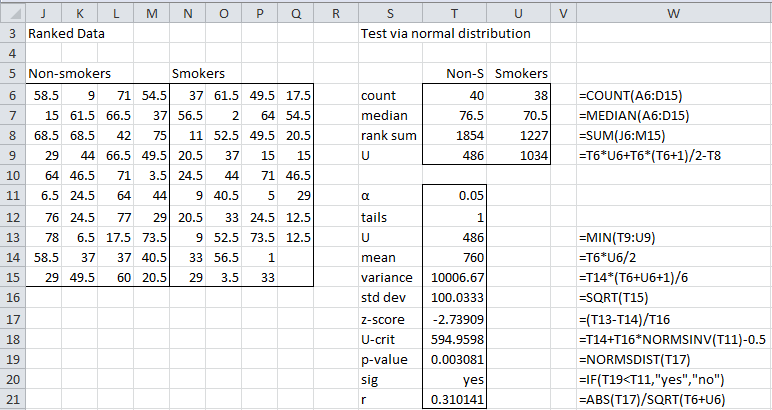
Figure 2 – Mann-Whitney U test using normal approximation
As can be seen in cell T19, the p-value for the one-tailed test is the same as that found in Wilcoxon Example 2 using the Wilcoxon rank-sum test. Once again, we reject the null hypothesis and conclude that non-smokers live significantly longer.
Effect Size
The effect size for the data using the Mann-Whitney test can be calculated in the same manner as for the Wilcoxon rank-sum test, namely
![]()
and the result will be the same, which for Example 2 is r = .31, as shown in cell T21 of Figure 2. This is a medium-sized effect.
Here, .1 is a small effect, .3 is a medium effect, and .5 is considered to be a large effect.
Rank-biserial Correlation
There is another measure of effect size, namely
![]()
p represents the probability that a score randomly generated from population A will be bigger than a score randomly generated from population B, where A and B are the populations corresponding to the two samples and A corresponds to the sample with the higher value. The higher this value is, the larger the effect.
The difference between p and its complement 1–p provides a standard effect size r called the rank-serial correlation. Thus
![]()
where μ is the mean of the normal approximation. For Example 2, the rank-serial correlation is r = 1 – 486/760 = .36, which is a medium-sized effect.
Worksheet Functions
Real Statistics Functions: The Real Statistics Resource Pack provides the following functions:
MANN(R1, R2) = U for the samples contained in R1 and R2
MANN(R1, n) = U for the sample contained in the first n columns of R1 and the sample consisting of the remaining columns in R1. If the second argument is omitted, it defaults to 1.
MWTEST(R1, R2, tails, ties, cont) = p-value of the Mann-Whitney U test for the samples contained in R1 and R2 using the normal approximation. tails = 1 or 2 (default). If ties = TRUE (default), the ties correction factor is applied. If cont = TRUE (default), a continuity correction is applied.
Any empty or non-numeric cells in R1 or R2 are ignored.
Observations
For Example 2, we can use the Real Statistics MANN function to arrive at the value of 486 for U shown in cell T9 of Figure 2, namely =MANN(J6:M15,N6:Q15) = 486. Similarly, the p-value of 0.003081 in cell T19 can be calculated by =MWTEST(J6:M15,N6:Q15,1,FALSE,TRUE).
Note that the z-score and the effect size r can be calculated using the Real Statistics function MWTEST as follows:
z-score = NORM.S.INV(MWTEST(R1, R2))
r = NORM.S.INV(MWTEST(R1, R2))/SQRT(COUNT(R1)+COUNT(R2))
The results of analysis for Example 2 can be summarized as follows: The life expectancy of non-smokers (Mdn = 76.5) is significantly higher than that of smokers (Mdn = 70.5), U = 486, z = -2.74, p = .0038 < .05, r = .31, based on a one-tailed test Mann-Whitney test with continuity correction, but no correction for ties.
Of course, you can also use a two-tailed test with a ties correction, as we demonstrate shortly.
Worksheet Array Function
Real Statistics Function: The Real Statistics Resource Pack provides the following function that returns output consisting of the U-stat, z-stat, r effect size, and three types of p-values (the normal approximation, exact test, and simulation).
MW_TEST(R1, R2, lab, tails, ties, cont, exact, iter): returns a column array with the output described above for the samples contained in R1 and R2. tails = 1 or 2 (default). For the normal approximation, if ties = TRUE (default) the ties correction factor is applied; if cont = TRUE (default) a continuity correction is applied; when exact = TRUE (default FALSE) then the p-value of the exact test is output and if iter ≠ 0 then the p-value of the simulation version of the test is output where the simulation consists of iter samples (default 10,000). If lab = TRUE (default FALSE), then an extra column of labels is appended to the output.
Any empty or non-numeric elements in R1 or R2 are ignored. See Mann-Whitney Exact Test and Mann-Whitney Simulation for more information about the exact test and simulation p-values.
Figure 3 displays the output from =MW_TEST(A6:A17,B6:B17,TRUE) for Example 2.
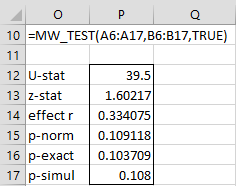
Figure 3 – Output from MW_TEST
Even if the argument is set to FALSE, the p-value of the exact test will be produced provided both samples have fewer than 800 elements, and the smaller sample has at most 300 elements.
Data Analysis Tool
Real Statistics Data Analysis Tool: The Real Statistics Resource Pack also provides a data analysis tool that performs the Mann-Whitney test for independent samples, automatically calculating the medians, rank sums, U test statistic, z-score, p-values, and effect size r.
For example, to perform the analysis in Example 1, press Ctrl-m and choose the T Test and Non-parametric Equivalents data analysis tool from the menu that appears (or from the Misc tab if using the Multipage user interface). The dialog box shown in Figure 4 now appears.
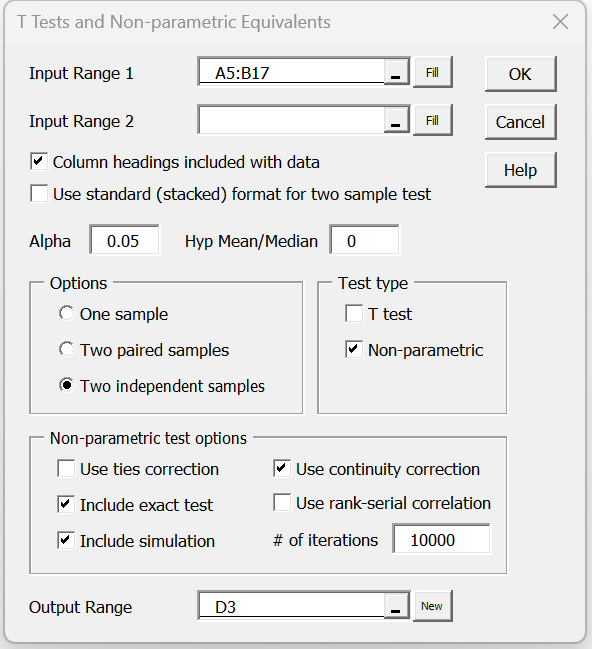
Figure 4 – Dialog box for Real Statistics Mann-Whitney Test
Enter A5:B17 as the Input Range 1 (alternatively, insert A5:A17 in Input Range 1 and B5:B17 in Input Range 2), click on Column headings included with data, choose the Two independent samples and Non-parametric options, and click on the OK button. Keep the default of 0 for Hypothetical Mean/Median and .05 for Alpha (although these values are not used). For this version of the test, we check the Use continuity correction, Include exact test, and Include table lookup options, but leave the Use ties correction option unchecked.
The output is shown in Figure 5.
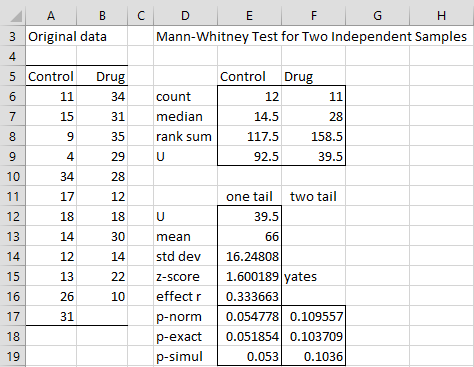
Figure 5 – Mann-Whitney test data analysis tool output
Note that both the one-tailed and two-tailed tests are displayed. Also, three versions of the test are shown: the test using the normal approximation (range E17:F17), the test using the exact test (range E18:F18), and the simulation test (range E19:F19). The fact that the “Yates” continuity correction factor is used is noted in cell F15.
Ties correction version
If we check the Use Ties correction option in Figure 4, we obtain the output shown in Figure 6.
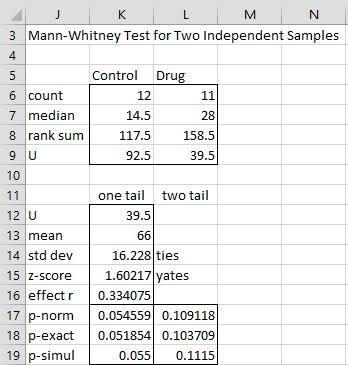
Figure 6 – Mann-Whitney test with ties correction
In this case, the ties correction of Property 3 is applied to the normal approximation. As you can see, there is very little difference between the outputs shown in Figures 5 and 6.
Note too that the ties correction (as well as the continuity correction) only applies to the normal approximation. The ties and continuity corrections are not applied to the exact and simulation versions of the test. The difference in the simulation p-values (row 19) in Figures 5 and 6 is due to the randomness of the simulations and not the ties correction.
Rank-serial correlation version
If the Use rank-serial correlation option were checked in Figure 4, then cell K16 in Figure 6 would contain the formula =1-K12/K13 with value .4015. Cell L16 would contain the value “rank-serial”.
Ties correction worksheet function
Real Statistics Function: The Real Statistics Pack provides the following function to calculate the ties correction used in the data analysis tool.
TiesCorrection(R1, R2, type) = ties correction value for the data in R1 and optionally R2, where type = 0: one sample, type = 1: paired sample and type = 2: independent samples
For the Mann-Whitney test, type = 2. The ties correction is used in the calculation of the standard deviation (cell U15 of Figure 6) as follows
=SQRT(K13*(K6+L6+1)/6*(1-TiesCorrection(A6:A17,B6:B17,2)/ ((K6+L6)^3-K6-L6)))
Exact Test
Click here for a description of the exact version of the Mann-Whitney Test using the permutation function.
Simulation
Click here for a description of how to use simulation to determine the p-value for the Mann-Whitney test. This approach takes ties into account.
Confidence Interval of the Median
Click here for a description of how to calculate a confidence interval of the median based on the Mann-Whitney Test.
Statistical Power and Sample Size
Click here for a description of how to calculate the statistical power or minimum sample size required for the Mann-Whitney Test.
Examples Workbook
Click here to download the Excel workbook with the examples described on this webpage.
Links
References
Howell, D. C. (2010) Statistical methods for psychology (7th ed.). Wadsworth, Cengage Learning.
https://labs.la.utexas.edu/gilden/files/2016/05/Statistics-Text.pdf
Zar. J. H. (2010) Biostatistical analysis 5th Ed. Pearson
Kerby, D. S. (2014). The simple difference formula: an approach to teaching nonparametric correlation. Comprehensive Psychology.
https://journals.sagepub.com/doi/pdf/10.2466/11.IT.3.1
Hello Charles,
I have determined that my data is not normally distributed, therefore I need to perform a non-parametric test. I am doing a project where I need to compare patient characteristics to literature. In some articles, I only have the median or only the mean of the group. Using the real statistics toolpack, I have managed to find the p-value for the characteristics where I only have the median. I was wondering how I could do the Mann-Whitney test if I want to compare my sample’s mean to a mean found in an article.
Nicole,
Do you have the data or just the two means?
Charles
Hello,
I have my data which consists of 48 measurements (example patient age) for which I can have its mean, median, standard deviation,etc… In some articles for their patients, they provide only the median, therefore I used the Wilcoxon Signed-Rank Test for a Single Sample to compare their median to my median (is this correct?). But in another articles, I only have the mean for the group and I don’t know how to go about it. Thank you!
Is the data that you have reasonably symmetric?
Charles
I drew the histogram for age and weight of my patients and it is not very symmetrical. I am required to use the U Mann Whitney test to do this.
Sorry Nicole, but I don’t know how to test whether a data sample comes from a population with a given mean using the Mann Whitney test or the Wilcoxon Signed Ranks test. When the data is symmetric, the mean and median are the same, and so assuming this is also true of the population from which the sample is drawn, then the Wilcoxon Signed Ranks test could be useful.
Charles
Hi Charles, hope you’ve been well!
I’m using the MW U Test for Likert Scale Data (5-point),
I just wanted to ask, if Sample 1 got a higher mean rank than sample 2, that means that Sample 1’s Likert scores has a higher average than sample 2. But for that test, the Z-score yielded a negative value which also means that it is below the mean distribution.
Wouldn’t that be conflicting? If not, then what other importance of Z-score that I am missing?
Thank you in advance.
Ken,
If you send me an Excel file with your data and test results, it will be easier for me to answer your question.
Charles
Hi Charles,
In the operationalization of Mann Whitney U test, after computing U1 and U2, why do we choose the minimum of them as U statistic?
Is there any logic or statistical reasons for it? Please elaborate.
Thanks
Anand
Hello Anand,
I don’t know for sure, but it is probably related to consistently using the same set of critical values (i.e. the same tail of the distribution).
Charles
Hello, very good information.
I wanted to ask you I have to do a statistical project about U-Mann Whitney/ANOV-systolic Pressure(mmHg) for the first 20 men and 15 first women. I have no idea how to start my work, but if you can help me with this work, I would be very happy. In addition to that, I need to be guided by Mario Triola’s book Edition 10 on page 786-787.
If you could please help me I would be grateful.
What the teacher requires for this work is :
Introduction/Objective
Data collection or Data provide
The topic of the projects -definitions, Hypotheses, formulas, calculations, tables, graphs, etc.
Thank you!!
Can anyone help me with that?
Yazmin,
I am happy to answer specific questions, but you need to do the homework assignment yourself.
Charles
Hi Charles,
Thank you for all your help with this real stats package. My queries might be too simple so apologies in advance. I have two independent groups of businesses: Group 1 low use of financial budgets and Group 2 high use of financial budgets. I want to show that Group 2 of businesses with high use of budgets have higher revenue. This was a survey based (likert scale) research not experimental.
a) which of the test statistic would you recommend I report? I have read this should be P exact. I have not applied continuity here.
b) Is there a particular rule as to which of the two independent group’s data I should put into input 1 field in your stats package? Should be it be group 1 by natural order? I don’t have a control group as such as I conducted survey research.
c) The reason I ask Question B above is when I switch it around and put group 2 data in input 1, it makes no difference to the test statistics reported in the statistics table. How does the real stats know which group is being compared to which? How do I know that my hypothesis that group 2 has high revenue is proven?
I hope that makes sense and thank you for your help!
Saad
Hello Saad,
a) If you don’t have any ties (or few ties), the exact test is probably the right choice. If the sample size is not too small then the normal approaximation is probably best if ties are an issue.
b) The order should not matter
c) With two groups, the two groups are compared to each other. If you get a significant result, then the group whose sample has the higher revenue is the group whose population revenue will be higher.
Charles
Really appreciate this response Charles!
Hi Charles
In example 1 (Control and Drug) both distributed normally. ( p values for normality test are 0.177 and 0.230)
Can we still apply nonparametric analysis or in this case should we apply 2-sample t test?
Hello Haldun,
If the data in both samples are normally distributed, then you should prefer to use the two independent sample t test.
Charles
Dear Charles
I’m sintia, i want to ask. I’m used Man Whitney U Test. But, in the result p-exact is VALUE. What should do? Any wrong with my data? N1 = 657 and N2 = 619
Thank you
Hello Sintia,
I don’t know why you got an error value, but with samples this large you shouldn’t use an exact test. The normal-approximation should be more than sufficient with such large samples.
Charles
Hi Charles,
I am utilizing your Excel tool to perform a Mann Whitney U-test on data that is not normally distributed. This is a very large data set with each sample set having 2,000+ data points. When performing the test for two independent samples, I get a p-norm value of 0. Is my data set too large for this statistical test or too large for this tool?
Any advice would be greatly appreciated.
Thanks.
The data set is not too large. The Real Statistics implementation of this test will support much larger data sets.
Charles
Is there a formula to use to run a Mann Whitney test for a paired sample without needing to use the Data Analysis Tool?
Hello Bradley,
The Mann-Whitney test is not used for a paired sample.
Charles
Dear Charles,
I liked your website and it is very helpful. I have one question. I am writing a research proposal and would like to get your comments. My research focuses on two independent districts one receiving intervention and the other district didn’t receive interventions. Both districts are independent (ordinal) but I have continuous variables to be collected by using questionnaire (the same questionnaire for the two districts). I want sample size of 200 for each district, which is large sample but can I use Mann-Whitney U test? How much sample size would you like to suggest or another test?
Hello Mathewos,
If your data is normally distributed, you can use a t test. You can test for normality using the Shapiro Wilk test. You can use the Power and Sample Size tool to determine whether a sample size of 200 is sufficient. All three of these topics are covered on this website. Enter the topic in the Search field.
Charles
Dear Charles,
the Addin is working just fine, but I cannot use the MWTEST function. DF_POOLED can be used, so it doesn’t seem to be a general problem and the dialog for statistical analysis is also working.
Can you please help me out?
Daniel,
I just checked the MWTEST function on my computer and it appears to be working. If you send me an Excel file with your data and results from the MWTEST function, I will try to figure out what is going wrong. Also what is the output from the =VER() formula?
Charles
Dear Charles,
Ver() gives me “5.5 Excel 2013/2016”. Is it an old version? I’m using Excel 2013. Is this ok? If yes, I can send you a test file. Also WELCH_TEST is possible to select when typing.
Thank you,
Daniel
Daniel,
The latest release is Rel 5.9, although 5.10 will be released in the next few days.
The MWTEST function was introduced in Rel 5.7.
Charles
I now downloaded https://real-statistics.com/wp-content/uploads/2018/10/RealStats.xlam. Now v5.9 is installed and MWTEST ist found. Thanks 🙂
Thanks Charles, this is interesting, I started thinking of methods to improve the performance 🙂
Regard the normal approximation, I find the following:
You use the following formula:
U=min(U1,U2)
z=( |U-μ| -0.5)/σ
By using absolute, we lose the option for distinguishing between left tale and right tale.
the test always assumes that H0 assumption is: bigger variable in the sample is bigger than the smaller variable.
I found that using Z=(U2-μ+c)/σ { when U > μ: c = -0.5, when U < μ: c = 0.5}
give you the option to choose between left and right tails.
like any other z test.
Oren
Hi Charles
Thanks for being so helpful 🙂
1. It is probably determined by the size of the table…
2. log sound good.
3. Can you please direct me to a faster approach? is it accurate as the tables?
Thanks,
Oren
Oren,
Glad I could help. I haven’t yet researched a faster approach.
Charles
Dear Charles,
I have several questions today 🙂
When is it reasonable to use the normal approximation? when n1+n1>20 or when n1>20 and n2>20?
When using the tables for small n, you get the critical values, but is there a good way to estimate the p-value?
When you calculated the exact accumulate probability in “Mann Exact” sheet, you calculated U for every combination, n!/(n1!*n2!) combinations.
Is there a faster way? or must you calculate U sperately every combination?
Thanks a lot,
Oren
Oren,
1. I have seen advice that says n1 > 20 or n2 > 20. I have seen n1 > 20 and n2 > 20. I have seen requirements that are higher, some that are lower. It is not clear.
2. The Real Statistics software estimates the p-values from the critical table using the MPROB function. You can estimate a p-value manually by various means. The simplest is to look a the table of critical values and find the value closest to your U value (for given values of n1 and n2) and then seeing what the alpha value is. The tricky part is how to interpolate (linear, log, harmonic). Generally log interpolation will yield the best result between alpha values.
3. There are faster approaches. I have not yet implemented these.
Charles
Hi Charles,
You used a tie correction for the normal approximation.
I can see R uses ties correction also for the Mann Whitney exact test.
Do you have any idea what is ties correction for the MW exact test?
Ps a better than log interpolation for p-value, but more memory consuming, is using a full table for all the values, not only for the specific p-values.
Thanks,
Oren
Oren,
I have some ideas for how to deal with ties, but I have decided to use simulation (instead of an exact test) in case of ties. This has been added in the latest release of the software, which came out a couple of weeks ago). In this release, I no longer use a table of critical values. Instead I use an exact test which can handle all p values, as you suggested). I have similar capabilities for the signed ranks test.
Charles
Hi Charles,
And I thought I might be able to help you …:)
I glad to hear you went to the correct direction.
What is the maximum n you handle now in the exact?
It isn’t coincident that in most tables 20 is the maximum. calculate more than 23 become very long, and each unit you add multiple the longest activity’s duration by 4 (like from 20*20 => 21*21).
Intuitively I would expect the MW exact with no ties to be accurate also with ties when calculating 0.5 per each equal value from the other group.
I understand that logically you have more combinations, like if n1=1,n2=2 instead of 2 combinations (a>b, b>a) without ties, there would be 3 combinations with ties (a>b,b>a,a=b) so the calculation should be with more combinations than simple MW with no ties.
Thanks,
Oren
Oren,
I appreciate any help you can give. Several people have contributed ideas, corrections and even code.
In the latest release, the exact test works well when the size of the smaller sample is at most 300 while the larger is at most 1,000. I changed the algorithm in this release and so I am now able to generate tables of much larger size.
Charles
Currently, I suggested on step forward, but you step 3 steps 🙂
I’m really impressed, a maximum of 300*1000 is really big, and I can see it is totally accurate!
Did you create a big table? or is it on the fly calculation?
Oren,
It is an on the fly calculation.
Charles
Hi Charles,
I would like to find out whether there is a statistically significant difference between my two samples (I compare e.g. Return on Equity of subsidies recipients with non-recipients, maybe it would be even better to find out whether one sample has better results than other). The samples are not normally distributed, which should mean I should use non-parametric test, according to my findings it should be suitable to use Mann Whitney test, however I don´t know if i should look at the 1-tail or 2-tail result in Real Statistics result and basically according to which criterion do I know if it is significant? (shall I look at the P-value if it is less or more than Alpha, or shall I compare the U with the U critical?) Thank you very much in advance. Regards, Michaela
Michaela,
1. Whether to use a one-tailed or two-tailed test really depends on how much a priori knowledge you have about the two populations. If you know that it is impossible for the mean of population 1 to be greater than the mean of population 2, then you can use a one-tailed test. Otherwise, you should use a two-tailed test. Since it is difficult to have such a priori knowledge, usually a two-tailed test is used.
2. “shall I look at the P-value if it is less or more than Alpha, or shall I compare the U with the U critical?” These approaches are equivalent and so you can choose either one and should get the same result.
Charles
Thank you very much Charles.
Hi Charles,
Very interesting website. Thanks. I try to apply to my own experiments
I have three groups (independent samples (each comming from a different individual)) to compare for one variable.
sample size of each group varies from 3 to 7
I thought to use Kruskall Wallis then compare 2 groups by 2 groups using Man Whitney.
Is it correct?
or do I need to have a minimum 5 sample per groups.
Could you help me?
Thanks in advance.
best
Vera
Hi Vera,
Use of Kruskal Wallis is appropriate instead of Mann-Whitney with more than 2 variables. Of course, you could use ANOVA instead if the assumptions are satisfied. If the reason for not using ANOVA is that homogeneity of variances assumption is violated, then Welch’s Test may be a better choice than KW.
Follow-up testing after KW (if you get a significant result) can be done with Mann-Whitney, but better choices are probably available. See the following webpage regarding this:
Kruskal-Wallis Follow-up Testing
Charles
Thanks foг sharing youг thoսghts about mann-whitney.
Regards
Hi Charles, what a helpful website! Thank you!
I wonder whether I can use Mann-Whitney U test for more than 2 variables. Not only “smoker” and “non-smoker”, let’s say there is also “social smoker” and even more than that. I look forward to your reply. Thanks!
Jake,
With more than two variables you would use ANOVA. The non-parametric counterpart to Mann-Whitney with more than two variables is Kruskal-wallis.
Charles
dear charles,
i am very glad that you are performing the real life means helping the others
i am going to conduct a study on the challenges facing secondary school head teachers due to terrorism in Bannu divission KPK (both male and female schools). the sample size are 30 female and 69 are male head teachers, the data was collected on a questionaire by five likard scale SDA,DA,U,A,SAso you are requested to guide me in usind the mann whitney u test to find the difference between the male and female head teacher manualy and on spss please
Muhammad,
I don’t use SPSS and so can’t give you any advice about this. The referenced webpage shows how to do this manually.
Charles
Dear Charles,
Can you please explain the difference between the results of Mann-Whitney and Mann- Whitney with continuity correction? According to the first, a difference is not significant. But, according to the second, it is significant.
How should the results be interpreted?
Thanks,
K
Kris,
There seems to be disagreement as to whether a continuity correction should be used. Some say yes, some say no. In any case, if you have a situation where the difference is significant without a continuity correction and not significant with a continuity correction (or vice versa), then the significant result is marginal anyway and should be reported as such. There is nothing magical about alpha = .05, and a result of .049 is really not much different from a result of .051. It is not the case that the small different between these two is so important.
Charles
Hi Charles,
The assumption of Mann Whitney test :
– Indepedent samples
– At least ordinal data
Is is correct ?
Paul,
Yes that is correct, but for certain analyses you also have the assumption that the two samples have the same shape.
Charles
Hi,
I performed Mann whitney test in R for testing total length by sex. My sample size is 1071 ( male= 523 & female=548). Im using MW due to my data dont fit a normal distribution. But, as a result I got a U = 130430. Could that be possible?
Many thanks
Francisco,
I can’t say for sure, but I would doubt that R would give the wrong answer, especially for such a popular test.
Charles
dear charles,
i performed mann whitney test on spss version 20.0. i got mann whitney test U value in thousands (e.g. U=1453) . my sample size was n=1280. i am confused to see this large value of U?? can this U value be in thousands?? U value may be in thousands?? please
Rais,
Yes, U can be this large.
Charles
Dear Charles,
I have two samples which have the sample size n1=102 and n2=110. I want to compare these samples using the U-test.
Could you, please, tell me how can I calculate the critical value for the Mann-Whitney U-test with given confidence level (0.05 or 0.01)?
Thanks a lot
Sergiy
Sergiy,
This is explained on the referenced webpage, namely with such a large sample you should use the normal approximation and therefore use the critical value for the appropriate normal distribution.
Charles
Hi
I performed a Wilcoxon rank-sum test with two samples x and y with sample size n_x=55 and n_y=20.
I have used matlab for this.
[p,h,stats] = ranksum(x,y)
Results are
p = 0.2678;
h = 0;
stats =
zval: 1.1082
ranksum: 853
What is the interpretation of this result? what does p value signify here?
Thanking you in advance.
Hello Abhijit,
The p value indicates that you can’t reject the null hypothesis. See the following webpage for how to interpret the p-value
Null and Alternative Hypothesis.
Charles
Regarding the Effect Size calculation for Mann-Whitney U = ( Z score / SQRT(N)), I am struggling to find any supporting reference to cite it in my thesis.
Any help please ? Thanks
Sergio,
See http://comp.uark.edu/~whlevine/psyc5133/fritz.morris.richler.2012.xge.pdf
Charles
Thank you so much, Charles
Hi,
First of all congratulation on your website.
I hope you can help me better understand the statistics behind the Mann Whitney test.
I have two very different sample sizes (n1 : 57, n2 : 4). Since n1+n2>20 U statistic should be considered normal with with U= n1*n2/2.
What I don’t get is how the p value which is then compared to 0.05 is obtained from the U statistic. What is the relation between the U statistic, p -value and the type 1 error alpha ?
Thank you in advance
Rhonda,
The U value is not n1*n2/2. The mean of the normal approximation is n1*n2/2 and the variance is n1*n2*(n1+n2+1)/12. You still need to calculate U as described on the referenced webpage and then p-value = 1-NORM.DIST(U, mean, stdev, TRUE).
Charles
Hello Charles,
Firstly, thank you for this clear and useful website !
Concerning Mann-Whitney U (M-W U) test application, a distinction is generally made between distributions of “same shape” or “different shape”. In the first case, M-W U compares the medians while in the second case, it compares mean ranks.
Does Real statistics enable to test for distribution shape ? Is there a link to the 3 different versions (norm/table/exact) displayed in the data analysis tool output ?
Also, I’m not sure I get how to choose between those 3 versions, with or without ties/continuity corrections … Which procedure do you follow generally to choose the most appropriated version (in order to state only one p-value at the end) ?
thank you,
Franck
Franck,
Your point about the shape issue is correct, but currently the Real Statistics software does not provide any test to determine whether the shape is significantly different. You can compare charts or histograms of both samples to see if they have the same shape.
The three versions of the test (norm, table, exact) are described on the website. Here is my advice as to which one to use.
For large samples, the normal approximation gives good results; if there are lots of ties then it is better to use the ties correction. There is not universal agreement as to whether or not to use the continuity correction; usually it won’t make a big difference either way. I tend to always use the ties correction (since if there are no ties the results are the same). I usually don’t use the continuity correction.
For small samples you should use the exact test or table of critical values. You shouldn’t use the normal approximation.
If there are no or few ties and the samples are small enough so that you can use the exact test, then I would favor that over the normal approximation, although the results should be very similar. The limitation of the exact test is that it is computationally intensive and doesn’t take ties into account.
Charles
Thanks for your answer !
If distributions have different shape, are the M-W U results obtained with Real statistics still correct ? I read that SPSS used two different test procedures (depending on same vs different shape) ?
Franck,
Yes. The Real Statistics software does not take shape into account when reporting the results.
I don’t know whether SPSS does or not.
Charles
Hello Charles,
thank you very much for this excellent explanation of the U-test. It really helped me a lot to understand the entire concept and also to pull it off in Excel.
Calculating my results however, I end up with an z-value of 14,41. (I transfered the result to a z-value, since I have n= 5314).
I am quite sure I did the calulations right. Is there a chance that you have a look at the Excel and help me out?
Thank you very much
Best regards,
Ben
Ben,
Yes. Please send an Excel file with your calculations to my email address as listed on Contact Us.
Charles
Hey Charles,
I sent you a mail. I hope it reached you.
Thanks a lot.
Ben
Ben,
I have received your email.
Charles
Hi Charles,
This website and tool are excellent!
I have a naive question regarding the test corrections.
I have a very small sample size: 2 groups with 3 data points each.
The two groups are clearly different between each other, but the 3 values from each group are very similar. What correction (ties, continuity) should be the most appropriate, if any?
Thank you very much.
Ruth
Ruth,
Glad you like the website and tools.
With such a small sample, it probably doesn’t matter much since any result will be somewhat suspect. I would use a continuity correction and probably a ties correction as well.
Charles
Hi,
congratulations for the website! It is really interesting.
I would ask you what is the good interpretation of the results of Wilcoxon-Mann-Whitney’s test and the null hypothesis.
I have two independent samples of 15 and 10 observations respectively that describe two different types of banks. I would like to use this test to verified if belong to one of the two groups is different from belong to the other group. Do you think that this test is useful to reach this result?
The Wilcoxon-Mann-Whitney test can be used for this purpose. Generally this test is used when the assumptions for the two sample t test are not met.
Charles
Great site,
Can I use this method to compare two different tests on the same individuals (compare the results from the entire populations of both test to see if there is a significant difference). I am currently using the receiver operating characteristics (ROC) analysis for each method to figure out which testing method can provide higher area under the curve but trying to link this to WMW test. Please help
Ali,
The Mann-Whitney test assumes independent samples, which by definition excludes the situation where both variables apply to the same individuals. You should consider using the paired t test or the nonparametric Wilcoxon signed ranks test.
Charles
Great resource…thanks a bunch. When I’m ready to do Mann- WHitney pairwise comparisons because the Kurskal-Wallis (non parametric ANOVA equivilent) model came back significant, must I adjust the alpha level by dividing by the number of pairwise comparisons I will be doing (as in a bonferroni adjustment) or just accept the default 0.05 alpha level?
Also, should I be reporting the the Mann-Whitney significance or that of the exact test (as I have had at least one data set come back contradictory)?
Thanks for your consideration!
Herman,
Thanks for your kind words about the Real Statistics resources.
If you are going to perform multiple post-hoc tests, you should correct for familywise error in some way (e.g. Bonferroni). In the next release of the Real Statistics Resource Pack I will add the Nemenyi post-hoc test which is like Tukey’s HSD test but for Kruskal-Wallis. This test will also correct for familywise error.
If the sample size is very small (under 10) then you shouldn’t use the normal approximation to the Mann-Whitney test, and so you should only report the exact version of the test. If you have lots of ties then unless your sample is very small, you shouldn’t use the exact test. In all other cases, if you are getting contradictory results from the Mann-Whitney test (normal approximation vs. exact test), you should report both results. If the results are very different, then there is probably an error. Otherwise, you need to show that the test is at the borderline between significant and not significant.
Charles
Hi Charles,
I’m using Nemenyi test, and in some cases I get a negative p-value back. Is there a problem with the test in your package?
Thanks a lot for this wonderful resource.
Amjad
Amjad,
That is strange. Can you send me an Excel file with your data and analysis? You can find my email address at Contact us.
Charles
I am trying to understand how the critical values for U are calculated. When I look up Ucrit for alpha(2)=0.05, n1=06, n2=12 in Zar 4th edition, I get 58, but your chart gives 14, and when I run the Mann Whitney U test for independent samples in Real Statistics it reports 24.072. What am I not understanding?
Thanks, Car
Car,
I believe that the values in Zar’s book are equal to n1*n2-crit where crit are the values shown in the table on the Real Statistics website.
I don’t know where you obtained the value 24.072. It looks like some value based on the normal approximation, but it doesn’t look like it comes from some table on my site. The value of the Real Statistics formula MCRIT(6,12,.05,2) = 14.
Charles
Hi Charles
When I am using the tool, the rank sum which it is calculating is significantly bigger than when I ask Excel to calculate the sum of the same values in the column. Any idea why that might be occurring?
Thanks
Fiona,
If you send me an Excel file with your data, I will try to figure out what is going wrong.
See Contact Us for my email address.
Charles
Hi,
Thank you for this useful tutorial. I have problem with using MANN_TEST. The problem is that the results of using MANN_TEST do not match the results of MANN(R1, R2)!! Even the sample counts are not correct when I use MANN_TEST…What is the problem?
Thank you again,
Ferra
I found the reason! I forgot to remove the check for “column headings included with data”.
Thank you
Firstly thank you for this wonderful website. Things are so well explained!
Secondly, I have a question for which the answer may be so obvious that I am ashamed to ask! But in figure 2, calculate the variance you use the formula
VARIANCE=(N1*N2/2)*((N1+N2+1)/6)
I just wonder where the ‘6’ at the end comes from?
Apologies in the advance if this is a daft question, or if it answered elsewhere (I have looked but couldn’t find anything. I do tend to get lost quite easily when dealing with formulas and numbers though!
Mark,
The answer is not so obvious. If you look at the proof of Property 2 on the webpage Mann-Whitney Test – Advanced you’ll see that the 6 is the result of some mathematical calculations.
Charles
Dear Charles,
First let me thank you for this website! It has been very useful – although I am just using the method/approach, not the computing programme.
Secondly, however, I am finding it difficult to understand my results/if i’ve calculated everything, or need more…
I have n1=37 and n2=37, with R1=1195.5 and R2= 1579.5…this gives me U1=876.5 and U2=492.5.
Now I know my ‘expected U value’ is 684.5, and I have a Stdiv of 92.5 and a Z value of -2.08
What do I take from this?
I know I can’t use a critical value table as the n>20 means its normalised… but what does this mean? Is there a critical value I can work out/get a reference-able source for?
Is there a difference between my data (what shows me this?)? What actually is Z (does it matter?)…do I need to calculate P, how would I do this?
Sorry for so many questions. I know I have glaring gaps in my understanding but I just haven’t been able to find anything on the web that explains things clearly (laymans English not this stats talk) for n>20 situations… Hope you can help!
Kind regards
Anna
Anna,
For samples sufficiently large you simply use one hypothesis testing using the normal distribution as described in Example 2, with additional details shown on the webpage:
https://real-statistics.com/sampling-distributions/single-sample-hypothesis-testing/
Charles
Dear Charles,
Thank you for the excellent resources pack. I am running the MANN_TEST function. I have no problem if I turn off correction but I have a lot of tied data so need it on. However, when on it returns “#VALUE!” for std dev so rest cannot be calculated. I cannot see why the correction for ties will not work. Please help.
I’m using the Excel 2007 version of the software.
Thank you,
Phil
(P.S. – I have a question regarding the Fisher Test function – is it accurate for larger then 2X2 tables – it returns a value for my 2×8 table but I’m not sure if its accurate. )
Philip,
If you send me an Excel file with your data I can try to figure out why it is returning #VALUE! for standard deviation when the Ties correction option is used.
The Fisher Exact Test as implemented only supports 2 x 2 tables.
Charles
Dear Charles,
I am trying to do Mann-Whitney test using data from Your example 1, but I get an error “A runtime error has occured. The analysis tool will be aborted. Type mismatch.”
The results looks as follow:
count 12 11
median 14,5 28
rank sum 117,5 158,5
U 92,5 39,5
and rest are blank
one tail two tail
alpha
I have excel 2013. Could You provide any suggestion? Thank You.
Andrey,
The usual problem is the setting of the value for alpha on the dialog box. This value defaults to .05, but for some languages you will need to re-enter the value as .05 or ,05.
Charles
Charles,
Many thanks, that was the solution. Thank You for quick response and the Real-Statistics pakage.
I have the big R1+R2 result can I get my r1 and r2 from that?
Nick,
I don’t know what r1 and r2 are, but note that R1 + R2 = n(n+1)/2 where n = n1 + n2.
Charles
Awesome website Charles. I’m taking reservoir characterization and your tutorials have really helped. I was trying to follow this tutorial and apply it to my data. Here’s the question: Using the Mann-Whitney test, does the fracture height documented by the initial analysis of scan lines A & B represent the same population of fractures, or different populations? The scan line measurements are at different intervals for A and B. For instance scan line A has distance from origin measurements of 0, 0.6, 1.8, and 4.4. With corresponding fracture heights of 0.4, 5, 12.6, and 9.6. Scan line B has distance from origin of 0.8, 3, 4.6, and 6.4 with corresponding fracture heights of 9.6, 4.8, 11.4 and 5.5. Is their a way to use MANN_TEST for these values. I realize that I must rank my fracture heights in relation to the distance from origin. So for the values I gave it would be: 0.4, 5, 9.6, 12.6, 4.8, 9.6, 11.4, 5.5. Scan line A no has a rank sum of 13 and B has a sum of 23. What would be the best way to perform a Mann-Whitney test?
Brandon,
If I understand your question properly, you should be able to use Mann-Whitney for this analysis using the approach described on the referenced webpage, including the MANN_TEST formula or the T Test and Non-parametric Equivalents data analysis tool.
Charles
Never mind, it just occurred to me the p-value for a 2-tailed test is (probably) twice the p-value of the one-tailed test 🙂
Hi Charles,
my compliments on the blog!
I was wondering if you could perhaps explain how the formulas in Example 2 change if you would like to calculate the values for a 2-tailed test.
Best
Nina
Hi,
first of all, congratulation on the website. It’s really well built, as least for me, a null at stats. And it’s surely an enormous amount of work that you’ve put at our disposition.
Thank you!
Unfortunately, i’m running an older version of excel, who does not support your package.
So, trying do go trough this test with samples n1=31 and n2=15, i’m having difficulty finding the critical value. furthermore, my results do not comply with the U1+U2 = n1n2 property… actually, U1 = U2 = n1n2…
i’ve gone through every formula and i did not find any mistake…
Could you help me?
Thanks in advance. Cheers,
Simao
Simao,
1. It is very strange that your results don’t comply with U1+U2 = n1*n2, since mathematically this should always hold. If you send me a spreadsheet with your calculations, I will try to figure out where the problem is.
2. The critical value for alpha = .05, two-tailed, n1 = 31 and n3 = 15 is 148.
3. The Real Statistics Resource Pack works with all Windows versions of Excel back to Excel 2002. Do you have an older version than this or are you using a version for the Mac prior to Excel 2011?
Charles
sir, what stat tool i’m going to use if i have two groups with unequal number of respondents? I want to determine if there is a significant difference in their performance in terms of the knowing, applying and reasoning skills of the students between the control and experimental groups?
with less than 40 respondents each group. thanks
Mann-Whitney U-test?
Provided the assumptions (normality, etc.) hold then you can use the t test for independent samples. If these assumptions are violated then you can use the Mann-Whitney U test.
Hi and thank you for all your work! Your website is an amazing resource for me.
As Fig. 4 shows there are two different output values for significance, rows 20 and 23. Where’s the difference? I got different results for some of my analyses and don’t know how to deal with it…
Felix
Hi Felix,
Row 20 is based on the normal approximation (when the sample size is large), while row 23 is based on the exact value using the table of critical values. If the sample is large (sample size > 20) then no row 23 is generated. If row 23 is generated then you should use the results from row 23; otherwise you should use the results from row 20 (the only choice).
Charles
Hi Charles
I noticed that calculating p-value using
MTEST(R1, R2, t) or
Ctrl-m and choose the T Test and Non-parametric Equivalents
gives different results (~ 10% different)!
Any insight pls?
Thanks
Saad,
I have never seen this before. It sounds lie an error. Can you send me an example where this is the case?
Charles
Hi Saad,
In al the examples that I have seen, the function and data analysis tool give the same results. Can you send me the example where the two results are different?
Charles
Any chance you can get the mean and standard deviation for two tailed Mann-Whitney U Test? I assume when it says Wilcoxon Signed-Rank Test for Paired Samples after I do the test it is actually the Mann-Whitney U Test, correct?
And what if I’m dealing with time? Do I still leave the Mean/Median at 0? Just want to make sure it doesn’t mess up my results.
And if this works, you are a LIFESAVER!
Amber,
The mean and standard deviation provided work for both the one-tail and two-tail tests. I just didn’t write the information twice (e.g. in Figure 4) since it is the same.
The Wilcoxon Signed-Rank Test for Paired Samples is not the same as the Mann-Whitney U Test, although they have many characteristics in common. If you have paired samples you should use the test described on the webpage https://real-statistics.com/non-parametric-tests/wilcoxon-signed-ranks-test/.
The Hypothetical Mean/Median field is not used with the current implementation of the Mann-Whitney Test or Wilcoxon Signed-Rank Test for Paired Samples, and so you may assume that the value is 0.
Charles