Objective
In Multiple t-Tests we describe how to deal with multiple paired sample t-tests using the approaches for dealing with familywise error described in Dealing with Familywise Error. The same approach can be used when the assumptions for the t-tests are not met, and so multiple Mann-Whitney tests are employed instead. We illustrate this approach by repeating Example 1 of Multiple t-Tests using multiple Mann-Whitney tests.
Example
Example 1: A school district uses four different methods of teaching their students how to read and wants to find out if there is a significant difference between the reading scores achieved using the four methods. A sample of students is randomly assigned to 4 classes, where each class uses a different one of the teaching methods. Based on the reading scores shown on the left side of Figure 1, determine whether there is a significant difference between the teaching methods.
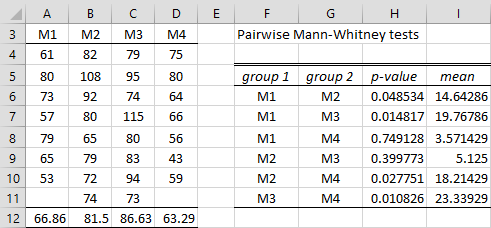
Figure 1 – Pairwise Mann-Whitney tests
There are C(4, 2) = 6 pairs of measurements (as shown in range F5:G11). A Mann-Whitney test can be performed for each of the 6 pairs by using the MWTEST function, with the p-values and mean differences shown in columns H and I respectively. From the data in range F6:H11, we can perform any of the multiple comparison tests described in Dealing with Familywise Error.
In Kruskal-Wallis Test we explore more tailored approaches for dealing with familywise error for these sorts of situations. We can use the One Factor Anova data analysis tool to create the p-values shown on the right side of Figure 1. This is done by pressing Ctrl-m and selecting the Analysis of Variance option and then the One Factor Anova option from the dialog box that appears (or from the ANOVA tab when using the Multipage interface). In either case, we can also fill in the dialog box that appears as shown in Figure 3 of Multiple t-Tests, except that this time you could select Pairwise MW (from the Kruskal-Wallis follow-up options).
Output
The output is shown on the right side of Figure 1. Since the samples are quite small, it would be better to use the signed-ranks exact test instead of the normal approximation. This is done by choosing the Pairwise MW Exact test option in the dialog box shown in Figure 3 of Multiple t-Tests. The result is shown on the left side of Figure 2, along with the Benjamini–Hochberg Test follow-up analysis (using the Multiple Tests data analysis tool described in Dealing with Familywise Error on the input range K6:M11) shown on the right side of the figure.
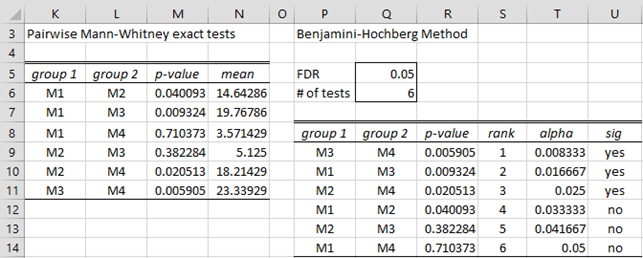
Figure 2 – Pairwise Mann-Whitney exact tests
Examples Workbook
Click here to download the Excel workbook with the examples described on this webpage.
References
Howell, D. C. (2010) Statistical methods for psychology (7th ed.). Wadsworth, Cengage Learning.
https://labs.la.utexas.edu/gilden/files/2016/05/Statistics-Text.pdf
Wikipedia (2018) False discovery rate
https://en.wikipedia.org/wiki/False_discovery_rate