Basic Concepts
Based on the relationship between the Mann-Whitney Test and the Wilcoxon Rank-Sum Test, we can modify the exact test described in Wilcoxon Rank-Sum Exact Test to provide an exact test for Mann-Whitney. In particular, we just need to subtract m(m+1)/2, where m is the size of the smallest of the two samples, from the Wilcoxon rank-sum statistic to get the Mann-Whitney test statistic.
Thus, to calculate the exact p-value for given values of U, n1, and n2, we can use the formula
=PERM2DIST(U+COMBIN(MIN(n1, n2)+1, 2), cum, FALSE)
Similarly, we can calculate the (exact) critical value Ucrit for given values of α, n1, and n2 via the formula
=PERM2INV(α, n1, n2, FALSE) – COMBIN(MIN(n1, n2)+1, 2)
These are the values produced by the formulas =PERM2DIST(U, n1, n2, cum) and =PERM2INV(α, n1, n2).
Worksheet Functions
Real Statistics Functions: The Real Statistics Resource Pack contains the following functions, which implement the exact p-value and critical value for the Mann-Whitney test.
PERM2DIST(x, n1, n2, cum) = value of the Mann-Whitney version of the two-sample permutation distribution at x based on n1 and n2 elements; returns the pdf value if cum = FALSE and the cdf value if cum = TRUE (default).
PERM2INV(p, n1, n2) = inverse of the Mann-Whitney version of the two-sample permutation distribution at p; i.e. the least value of x such that PERM2DIST(x, n1, n2, TRUE) ≥ p.
These are the same worksheet functions described in Wilcoxon Rank-Sum Exact Test, except that in the last argument, FALSE is replaced by TRUE. If this argument is omitted, it defaults to TRUE, representing the Mann-Whitney exact test.
The Real Statistics Resource Pack also supports the following worksheet functions:
MWDIST(x, n1, n2, tails) = value of the Mann-Whitney distribution at x based on n1 and n2 elements, where tails = 1 (default) or 2. This is the p-value as defined above
MWINV(p, n1, n2, tails) = inverse of the Mann-Whitney distribution at p. This is the least value of x such that MWDIST(x, n1, n2, tails) ≥ p, where tails = 1 (default) or 2; i.e. U-crit as defined above
MW_EXACT(R1, R2, tails) = p-value of the Mann-Whitney exact test on the data in R1 and R2, where tails = 1 or 2 (default)
Observations
Note that if x < (n1*n2)/2, then
MWDIST(x, n1, n2, 1) = PERM2DIST(x, n1, n2)
MWDIST(x, n1, n2, 2) = 2*PERM2DIST(x, n1, n2)
while if x ≥ (n1*n2)/2, then
MWDIST(x, n1, n2, 1) = 1–PERM2DIST(x, n1, n2)
MWDIST(x, n1, n2, 2) = 2*(1–PERM2DIST(x, n1, n2))
Also, if p ≤ .5, then
MWINV(p, n1, n2, 1) = PERM2INV(p, n1, n2)
MWINV(p, n1, n2, 2) = PERM2INV(p/2, n1, n2)
while if p > .5, then
MWINV(p, n1, n2, 1) = PERM2INV(1–p, n1, n2)
MWINV(p, n1, n2, 2) = PERM2INV((1–p)/2, n1, n2)
Thus for the two-tailed test for Example 1 of Mann-Whitney Test, we have
MWDIST(H11,H5,I5,2) = .1037
MWINV(.05,H5,I5,2) = 33
MW_EXACT(A6:A17,B6:B16,2) = .1037
Recursive Approach
The approach described in Wilcoxon Rank-Sum Exact Test for manually calculating the exact p-values is quite slow. Instead, we can use the following properties to recursively perform the calculations.
For samples of size m and n, the sampling frequency of the U statistic fm,n(U) has the following property when m > 1 and m ≤ n:
![]()
where U takes values between 0 and mn. Also, define fm,n(U) = fn,m(U) when n < m and
![]()
Example
Example 1: Calculate the frequency function f3,4(U) for all possible values of U.
U takes values from 0 to 3∙4 = 12. Since 4 is the larger of the two sample sizes, we need to calculate the values of fm,n(U) for all values of m = 1, 2, 3, and n = 1, 2, 3, 4 where m ≤ n and for all values of U = -4, -3, …, 11, 12. This is shown in Figure 1.

Figure 1 – Mann-Whitney Exact Test
We start by filling in the value of zero for U < 0 (columns D through G). We next fill in the values for row 4, namely 1 for U = 0, 1, 2 = n, and 0 elsewhere. The values for rows 5 and 6 are similar.
For row 7, we use the fact that f2,2(U) = f1,2(U-2) + f2,1(U) = f1,2(U-2) + f1,2(U). This is implemented by placing the formula =F4+H4 in cell H7, highlighting the range H7:T7, and pressing Ctrl-R. For row 8, we use the fact that f2,3(U) = f1,3(U-3) + f2,2(U), and place the formula =E5+H7 in cell H8, highlight H8:T8 and press Ctrl-R. Rows 9, 10, and 11 are filled in a similar manner.
From row 11, we get the frequencies and cumulative distribution values for samples of size 3 and 4, as shown in Figure 2.
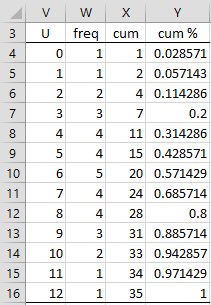
Figure 2 – Exact distribution
Column V is the transpose of H3:T3 from Figure 1, and column W is the transpose of H11:T11 from Figure 1. As usual, column X is calculated by placing the formula =X3+W4 in cell X4, highlighting the range X4:X16, and pressing Ctrl-D. Column Y is calculated by placing the formula =X4/X$16 in cell Y4, highlighting range Y4:Y16, and pressing Ctrl-D.
Note that =PERM2DIST(9,3,4) has the value .885714, as shown in cell Y13 of Figure 2. Also =MWDIST(4,3,4,2) has the value 2*.314286 = .62857.
Worksheet Array Function
Real Statistics Function: The Real Statistics Resource Pack contains the following array function that calculates the complete range of exact p-values for the specified sample sizes.
PERM2_DIST(n1, n2, cum) returns a column array with the p-values of the Mann-Whitney exact test for values of U from 0 to n1*n2 when cum = TRUE (default) and the frequency values when cum = FALSE.
The formula =PERM2_DIST(3,4) returns the array in range Y4:Y16 of Figure 2 and the formula =PERM2_DIST(3,4,FALSE) returns the array in range W4:W16.
As observed in Wilcoxon Rank-Sum Exact Test, the functions PERM2DIST, PERM2INV, MWDIST, MWINV, MW_EXACT, and PERM2_DIST work pretty well where the smaller of n1 and n2 is at most 300 while the larger is at most 1,000. You will be able to use larger sample sizes, but calculation times may become unacceptably long or overflow errors may occur.
Examples Workbook
Click here to download the Excel workbook with the examples described on this webpage.
Links
References
Wild, C. (1997) The Wilcoxon Rank-Sum test
No longer available online
Marx et al. (2016) Exact dynamic programing solution of the Wilcoxon–Mann–Whitney test
https://www.ncbi.nlm.nih.gov/pmc/articles/PMC4792850/
Dear charles
Please I need a clearer explanation on how tosolve this formula u=n1n2+1(n1+1)/2 R1, Expecially how the R1 and R2 is gotten.
Hello Victory,
Sorry, but I don’t understand what “y=n1n2+1(n1+1)/2” means. In any case, I don’t see anything resembling this on the webpage.
Charles
Dear charles
Can you please give me a clearer explanation on how to solve this formula y=n1n2+1(n1+1)/2 R1? Expecially how the R1 and R2 is gotten.
Hello Victory,
Sorry, but I don’t understand what “y=n1n2+1(n1+1)/2” means. In any case, I don’t see anything resembling this on the webpage.
Charles
Dear Charles,
Could you explain me what is the difference between pairwise MW test and pairwise MWexact test?.
Thank you in advance!
Best regards from Bahia Blanca, Argentina
Hello Marcelo,
Good to communicate with someone from Argentina.
The MW test uses an approximation approach based on the normal distribution for larger samples and a table of critical values for smaller samples. It is usually pretty accurate.
The MW exact test does not use an approximation and calculates an exact value. This exact value assumes there are no ties. The calculation can be time-consuming for larger samples.
Charles
Hey Charles,
could you please provide a reference for the recursive U distribution formula? Also, perhaps a similar formula exists for calculating U distributions when tied ranks are possible? Thanks!
Hi Peter,
For example
Normal Approximations to the Distributions of the Wilcoxon Statistics: Accurate to What N? Graphical Insights
Carine A. Bellera, Marilyse Julien, James A. Hanley
Journal of Statistics Education, 2010
Charles
Charles,
For the first permutation distribution value (ie, PERM2DIST), should we subtract COMBIN(Min(n1,n2)+1,2) from U instead of adding it?
-Sun
Sun Kim,
I believe that we add COMBIN(MIN(n1,n2)+1,2) instead of subtracting it.
If we look at the table of critical values for the Mann-Whitney test, we see that for alpha = .05 and n1 = n2 = 10, the critical value is 23. For the same parameters, the critical value for the Sum Ranks test is 78, which the same as 23 + C(10+1,2).
Thus, for U = 23, we have PERM2DIST(U+COMBIN(MIN(n1, n2)+1, 2), TRUE, FALSE) = PERM2DIST(78,TRUE,FALSE) = .05, which the same as PERM2DIST(U,TRUE,TRUE).
If the last argument in PERM2DIST is FALSE we are conducting a Sum Ranks test, while if it is TRUE we are conducting a Mann-Whitney test.
Charles
Dear Charles,
could you please explain me why you multiply the PERM2DIST by two to obtain the p-value for the two-tail Mann-Whitney exact test?
–> p-value = 2 * PERM2DIST(COMBIN(MIN(n1, n2)+1,2)+U, n1, n2, TRUE)
Does that have something to do with the test being two-tailed? I’m currently writing my thesis and in my text book I have the following data: μ = 12; standard deviation = 4,59; the calculated U-value = 11. In the text book they then calculate the normal distribution of these values and multiply the obtained value by 2 to get the p-value (0,828), but unfortunately they don’t explain why they do it. If you draw a quick sketch of the distribution, you see that the U is left of the μ and if you want to calculate the area from -infinity to U, I wouldn’t multiply it by two – could you please explain me why you do that? Thanks a lot.
Best regards from Austria,
Sonja
Sonja,
For a symmetric distribution the two-tailed p-value is double the one-tailed p-value.
Charles
Thanks a lot, Charles!