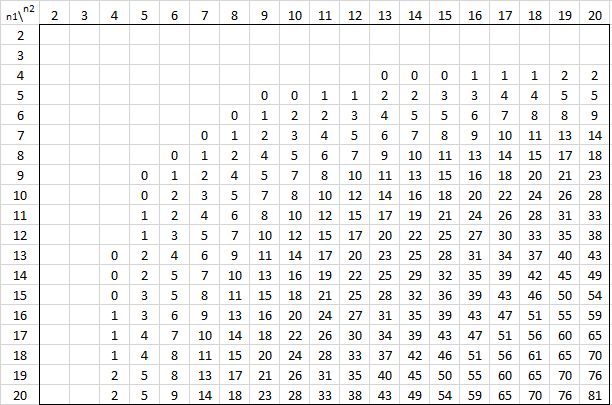
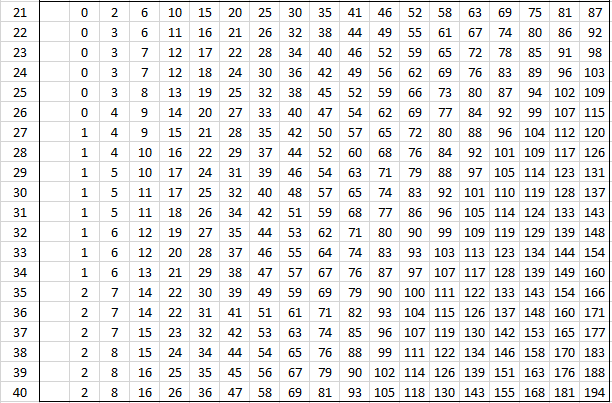
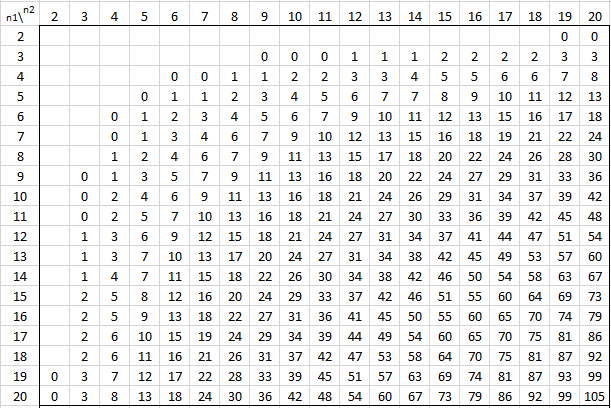
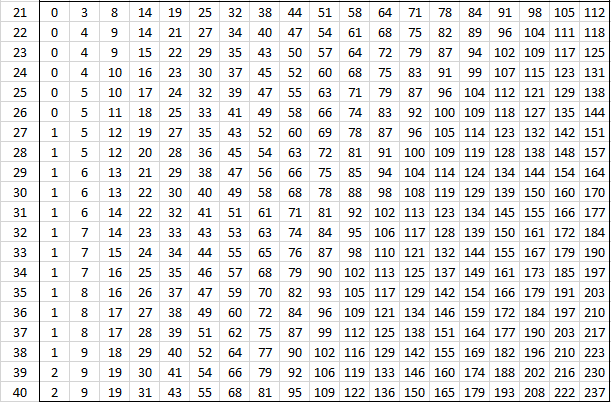
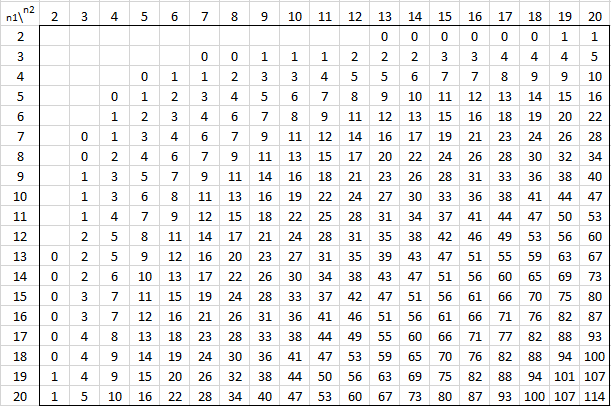
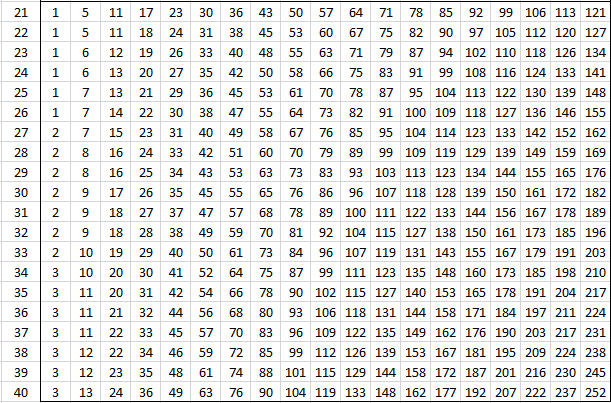
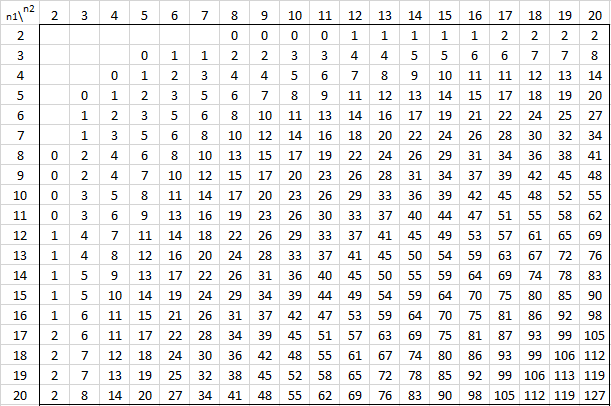
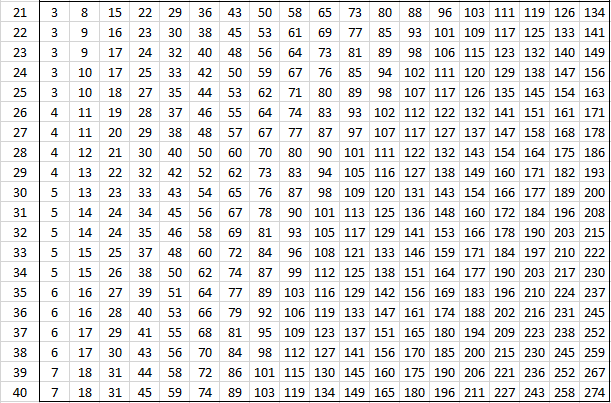
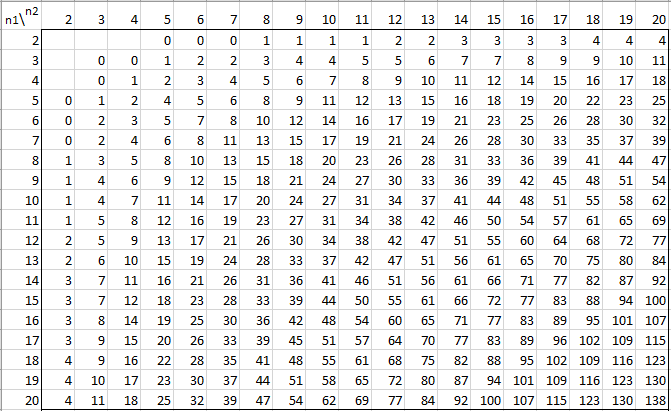
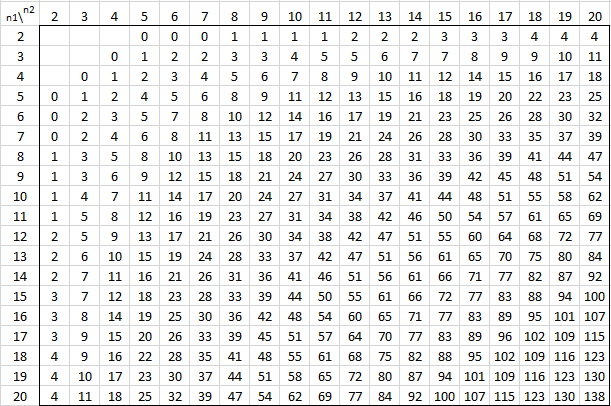
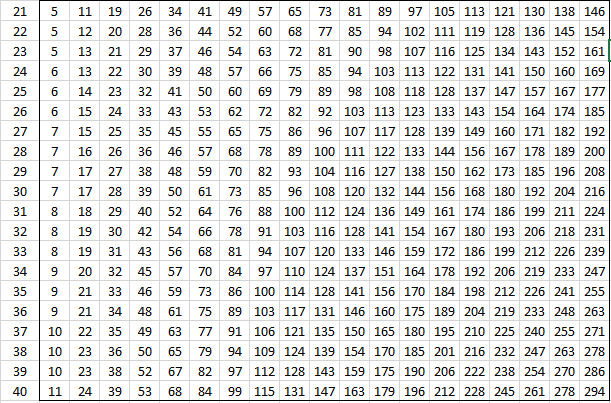
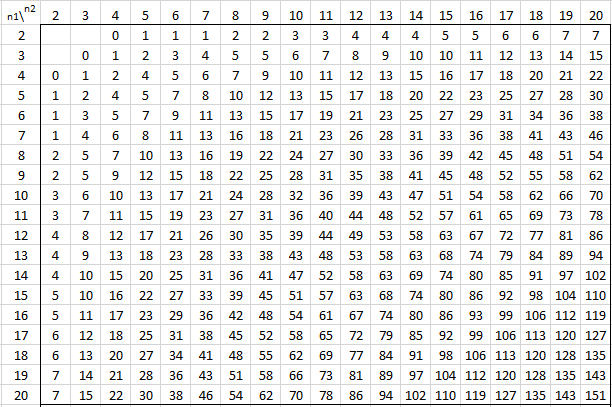
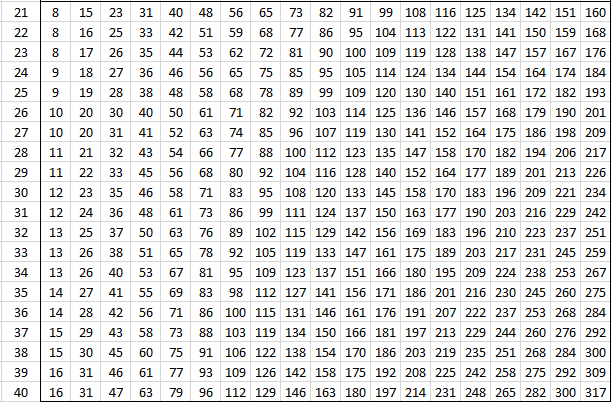
The following tables provide the critical values of U for various values of alpha and the sizes of the two samples for the two-tailed test. For one-tailed tests double the value of alpha and use the appropriate two-tailed table. See Mann-Whitney Test for details.
Alpha = .001 (two-tailed)
Alpha = .005 (two-tailed)
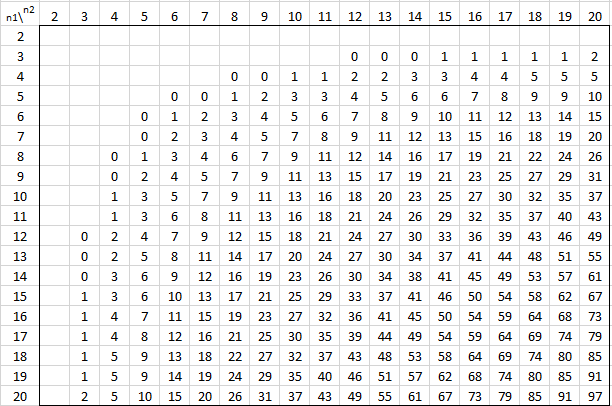
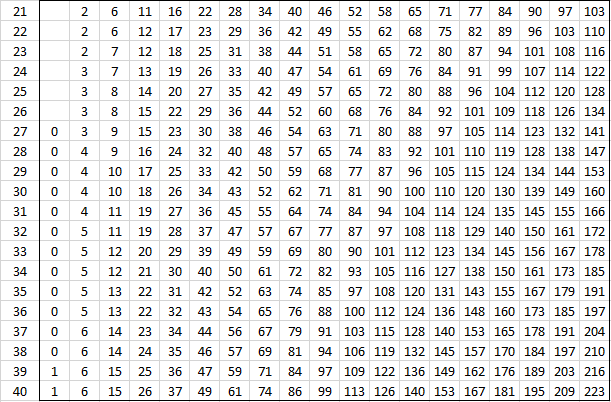
Alpha = .01 (two-tailed)
Alpha = .02 (two-tailed)
Alpha = .05 (two-tailed)
Alpha = .20 (two-tailed)
Links
Download Table
Click here to download the Excel workbook with the above table.
References
Zar. J. H. (2010) Biostatistical analysis 5th Ed. Pearson
https://www.pearson.com/us/higher-education/program/Zar-Biostatistical-Analysis-5th-Edition/PGM263783.html
Laverty, W. H. (2008) Critical values for the Wilcoxon/Mann-Whitney test (U)
No longer available online
Milton, R. C. (1964) An extended table of critical values for the Mann-Whitney (Wilcoxon) two-sample statistic. Journal of the American Statistical Association, Vol. 59, No. 307, pp. 925-934
https://www.yumpu.com/en/document/view/18626110/an-extended-table-of-critical-values-for-the-mann-whitney-
Good day! I have an important question: The title of the research is evaluation of the school intramurals. The researchers’ respondents are 220 students and 21 teachers. The researchers utilized a Likert scale questionnaire with 4 ranks, namely, Strongly Agree (4), Agree (3), Disagree (2), and Strongly Disagree (1). After getting the data, the researchers would like to know if the evaluation between the 220 students and 21 teachers has a significant difference. How will the researchers calculate the difference using the Mann-Whitney U test? And what data will they use? Is it the weighted mean per each statement? And is it possible to use Mann-Whitney U test with 220 students and 21 teachers?
Hello Willin,
1. How will the researchers calculate the difference using the Mann-Whitney U test? You won’t be able to use the table, but the normal approximation should work. See https://real-statistics.com/non-parametric-tests/mann-whitney-test/
2. And what data will they use? Is it the weighted mean per each statement? What data to use depends on how you aggregate the evaluations, but the weight mean may be a reasonable approach.
3. And is it possible to use Mann-Whitney U test with 220 students and 21 teachers? Yes, you can use the Mann-Whitney test even with such unbalanced datya.
Thank you so much for this detailed answer. I really appreciate your help. I have a follow-up question regarding the data to be used since the questionnaire is a Likert Scale, it has a breakdown of factors with 3 statements each. Will the researcher get the weighted mean per factor and use Mann-Whitney U test or will they get the whole grand weighted mean per questionnaire?
Hello Willin,
You can only have one score per person filling out the questionnaire (otherwise you can’t use Mann-Whitney nor most other tests since data must be independent).
Charles
Hello!
I have a question regarding the presented critical values of U for various values of alpha here. As I understand, those values are from your source “Milton, R. C. (1964) An extended table of critical values for the Mann-Whitney (Wilcoxon) two-sample statistic. Journal of the American Statistical Association, Vol. 59, No. 307, pp. 925-934”.
You also stated another source “Zar. J. H. (2010) Biostatistical analysis 5th Ed. Pearson”, where one can find explanation for the Mann-Whitney-U-Test in chapter 8.11. This chapter then also refers to a table of critical values of U for various values of alpha in Appendix B, Table B.11. This table offers vastly different values for U, considerably higher compared to those presented on here.
What are the differences of those tables of critical values for U and when to use which table, since the use of either of those for the same calculation will lead to very different outcomes of the statistic.
Thank you in advance for your answer!
Tom,
It is a good question. I don’t know why the tables are so different.
The table on the website was developed by me using the Mann-Whitney exact test. See
https://real-statistics.com/non-parametric-tests/mann-whitney-test/mann-whitney-exact-test/
If I remember correctly, the table value is almost identical to one of the standard tables (perhaps the Milton table), only differing slightly in a few places.
Charles
Hello! I hope you can answer me. What is the Critical Value if N1=22 and N2=22? 0.05 level of significance two tailed.
Thank you in advance!
Hi Karen,
For values over 20, you should use the normal approximation instead of the table of critica; values.
See Mann-Whitney Test
Charles
what does it mean if I choose an alpha level of 0.2? since it is the only table that can extract a value because my n1 and n2 are both equal to 3
With such small samples, you shouldn’t expect too much from the analysis.
With alpha = .2 you could get a significant result, but it won’t be significant for smaller values of alpha, especially alpha = .05, which is usually the value of alpha that is used.
Charles
Hi Charles,
When we use Mann-Whitney Test for single subject data, do we need different table for U critical values?
thanks in advance
Hello Seyed,
You should use the Signed Ranks test instead of Mann/Whitney in the one-sample case. This uses a different table of critical values. See
https://www.real-statistics.com/wilcoxon-signed-ranks-test/
https://www.real-statistics.com/wilcoxon-signed-ranks-table/
Charles
Hi Charles,
I am testing two datasets for differences in means. n1=650 and n2=24.
This dataset has drastically different sample sizes. Looking only at the histogram of both samples show that n1=650 is normally distributed (approximately bell shaped) and n2=24 is not normal (but with a little bit of imagination the smaller sample could also be considered normal).
Anyways, I’m considering two approaches:
First, I used bootstrapping for the smaller sample to generate a bigger sample of size n2,(bootstr.)=650 and to compare the means of n1=650 and n2,(bootstr.)=650 using a t-test. Result: not-significant!
Question1: is it allowed to compare an original sample with a bootstrapped sample?
Second, I am taking randomly 24 samples from the bigger sample of n1=650, giving me 24 values in one row. I repeat this 24 times (resulting in 24 rows and 24 columns). Then I calculate 24 means for the resampled values.
Now I would like to conduct a MWU test with the resampled means n1,(resampled)=24 and the original data from the second sample (n2=24).
But, how do I get the critical value for the MWU test when my sample size for n1=24 and n2=24 as well, since the MWU table only includes values for n1 of 20?
Question2: Is this a useless approach to test the differences in means?
Thank you for your answer in advance.
Best regards,
Ataman
Q1: You can certainly perform such an approach, but I don’t know whether this is useful in making the test that you want. You could simply perform a t-test using the original data. The samples don’t need to be the same size. If the data are not normally distributed you could use the Mann-Whitney test, but in this case, you aren’t testing the means, you are testing the medians (assuming that the two samples come from similarly shaped distributions).
Q2: You don’t need to use the table of critical values when the sizes of the samples are bigger than 20. You can use the normal approximation, as described at
https://www.real-statistics.com/non-parametric-tests/mann-whitney-test/
You can probably also use the Mann-Whitney Exact Test (essentially this extends the table of critical value past 20). See
https://www.real-statistics.com/non-parametric-tests/mann-whitney-test/mann-whitney-exact-test/
I don’t think this approach is useless for your purposes, but as described in my response to Q1 you can probably use a simpler approach. Also, you don’t need to limit yourself to 24 repetitions; you can use a much larger number if you like.
Charles
Hi Charles,
Thank you very much for your answer.
So, I could use a normal t-test for difference in means of two samples, where n1=650 is normally distributed (histogram & CLT) and n=24 is not normally distributed?
Is there a reference for this that I could use? Because I thought that both samples have to be appr. normally distributed in order to use the t-test.
Best regards,
Ataman
Hi Ataman,
Both samples do need to be approximately normally distributed, although the test is somewhat robust to minor violations. When in doubt, you can consider using the Mann-Whitney test. Alternatively, you can use resampling. Both of these approaches are described on the Real Statistics website.
Charles
Hi Charles,
thank you for your answer. This is exactly how I want to proceed. First the t-test, then the bootstrapping and the MWU. Then I will present the final results with some comments.
Btw, I have installed your excel add-in and rearranged one MWU test results one column. Now I can do thousands of MWU tests and present the proportion of results that rejected the H0 and those that failed to reject it, as my Prof.asked me to do.
But, the beautiful thing is that I do not need to teach myself right now how to do it all with MATLAB or any other data analysis tool.
I owe you big time Charles.
One I’m finished with my thesis and hopefully get a job, I will donate to support you. But your help is unplayable to me!
Thank you very much for your support.
Best regards,
Ataman
Is there a certain sample size that is most accurate for a Mann Whitney U test. I was planning on using a sample of 20 from both my populations, however, I can’t think of any reason as to why this would be favourable especially as I could potentially do a sample of 30 from both populations. Would a sample of 30 be best to increase the validity of my results and if so what would the critical value be for a one-tailed test with a sample of 30 from both populations at 0.05 significance level (I cant seem to find any table online for a sample of this size).
Imaan,
Sample size is most related to statistical power (which is one minus the type II error). There are tables that relate sample size to statistical power for the t-test. For nonparametric tests, the relationship between sample size and power can determined based on simulations or approximations from the t-test.
The short answer to your question is the larger the sample sizes, the better. In general, if one sample is larger than the other, then adding elements to the smaller sample has a larger benefit (in terms of statistics power) than adding elements to the larger sample.
Since the larger the sample size the better, what is the limit? In general, the limit is the effort (time, money, etc.) it takes to increase the sample size. Another way to look at the problem is to look at the expected power of the test at say a sample of size 20. If this is insufficient for your needs then you need to increase the sample size; if not samples of size 20 should be ok. How do you decide on large the power needs to be? This is similar to deciding on the significance level, which traditionally set to alpha = .05. Power is traditionally set to .90. Achieving this level of power depends on how big an effect you need to detect (assuming that you get a significant result).
The Real Statistics website covers all these topics.
Charles
Hi, why do I have to double the critical value for a one-tailed test? Why does this factor make a difference to the results?
If my test was one-tailed, then I would have to accept the null hypothesis, however with a two-tailed test I would have to reject the null hypothesis.
(My calculated value of U is 178, and so it is greater than the critical value of 112 at 0.01 significance level with N20 and N21. However, because it is a one-tailed test, I have to double the critical value – 112×2=224, and so my calculated value is now less than the critical value. Thus my results are significant for a one-tailed test but not a two-tailed test. I can’t understand this concept. Please can you explain this to me?)
Fahimah,
You don’t double the critical value. You double the alpha value. The critical value for a one-tailed test at alpha = .05 is equivalent to a two-tailed test at alpha = .10.
Charles
Hi,
Thank you so much, that makes sense now 🙂
tldr: Reject H0 when U=U_critical.
Really useful tables, Charles! However, some clarification would help on when the critical value coincides with the obtained value of the statistic U.
According to the definition given in
https://www.real-statistics.com/non-parametric-tests/mann-whitney-test/,
we require U to have a smaller value than the critical value U_critical to reject the null hypothesis H0 of equal chance of victory of either group. However, it doesn’t make much sense that, for example, in Alpha = .05 (two-tailed) and n1=3, n2=5, U_crit=0 is not an empty cell, since we’d have to score a negative number U of victories to score smaller than 0, which is impossible.
If we have 0 overlap between two groups of 3 and 5 samples, scoring U=0, I’d rather say that we can reject the null Hypothesis, as we see in https://github.com/Hatchin/Mann-Whitney-U-Test/blob/master/mannwhitney.py line 100
or in the final comments from
https://math.usask.ca/~laverty/S245/Tables/wmw.pdf
Àlex
Alex,
The explanation in https://math.usask.ca/~laverty/S245/Tables/wmw.pdf is correct.
Dashes (-) indicate that the sample size is too small to reject the Null Hypothesis at the chosen α level
Charles
Good afternoon. If my n1 = n2 = 33, what is my critical value of U?
unilateral test, alpha = 0.05
Dandara,
Since n2 > 20, you need to use the normal approximation instead of the table. See the following webpage for details:
Mann-Whitney Test
Charles
Goodmorning sir,
My U value came out to be 1021. What should i do now?
Use the normal approximation and not the table. This is explained at
https://www.real-statistics.com/non-parametric-tests/mann-whitney-test/
Charles
Can this table be used for Moses Extreme Reaction Test?
Mark,
I don’t believe that it is. See the reference in my response to your previous comment.
Charles
Hi there,
Thanks so much for your guidance. This has been very helpful for my university dissertation. I was wondering if you could tell me where you got this table from, I would like to reference it for my work.
Additionally, How do I know what the statistical power of the Man Whitney U test on SPSS, with n=5 and n=52?
Thanks again,
Lisa
Hi there,
In addition to my previous comment, what do I do if my sample is n=41? do I just use the p value?
Hello Lisa,
You can’t use the p-value as the power. See my previous response.
Charles
Hello Lisa,
1. I created the table using the Mann-Whitney exact test, as described on the Real Statistics website. It is almost identical to the table that you will find in numerous places on the web, but there are a few small differences.
2. I don’t use SPSS and so I can’t advise you about that. The statistical power of the Mann-Whitney test depends on the distribution of the data and you can estimate the power of the test as described at
https://real-statistics.com/non-parametric-tests/mann-whitney-test/mann-whitney-power/
Charles
Thank you so much, sir.
I also wanted to add that number of observations is different for both males and females. And the differences in the values follow a symmetrical pattern when plotted using a histogram.
Even then this test would be valid right!
Hello sir,
In my dataset, I have a column that contains the test scores (on an ordinal scale taking values 0,1,2,3,4) for males and females. I want to test the similarity or to be more precise the statistical significance of differences if any in the scores for males and females and also the number of observations is quite large. So which particular test I should run in stata to do so?
Depending on the details, the Mann-Whitney test may be appropriate.
Charles
Thank you so much, sir.
I also wanted to add that number of observations is different for both males and females. And the differences in the values follow a symmetrical pattern when plotted using a histogram.
Even then this test would be valid right!
Hello Sanchita,
The sample sizes don’t have to be the same to use the Mann-Whitney test.
Provided the symmetrical pattern doesn’t violate the independence assumption, this should not be a problem.
Charles
Hi,
I have read the responses about calculating the critical value in larger sample sizes. I also note your reply to libby, below.
Please forgive me, but I still don’t understand how these calculations were made!
I have a much larger sample size (339 and 494), but as my data are not normally distributed and because I believe the median is a better measure in my study than the mean I am using non-parametric test (or trying to!).
Hi Laura,
With such large samples, I suggest that you use the normal test version of the Mann-Whitney test. In this case, you will get a p-value. It is better to use this value than to try to find the appropriate critical value. See
Mann-Whitney Test
Charles
Hi, I have read previous comments about larger sample sizes (mine are 96 and 83) and have tried to follow onto the linked pages to property 2 but I still do not understand how to calculate my critical value.
Thank you for your help!
Hello Libby,
Based on Property 2 and sample sizes 96 and 83, mean m = 3984 and standard deviation s = 345.7. Thus, the critical value is NORM.INV(.05,m, s).
It is better, however, to calculate the p-value directly.
Charles
I am using the 0.20 table as a reference for my critical value. The critical value I need to use according to the table is 0. My value for U is also 0. So I thought that means there is an 80% chance that I can accept my alternative hypothesis. I’ve read elsewhere that a critical value of over 0.05 means that ‘we cannot conclude that a significant difference exists’. Firstly, is that true in this context, and if so does this mean I cannot reject my null hypothesis?
The reason I am using the 0.20 table is because I have 3 values for both N1 and N2. This is only table that has a value for N1 and N2 both being 3
Hi Charlie,
With a sample of only 3, you can’t expect the test to demonstrate much. In fact you can’t get a significant result for alpha = .05 or .10 (which is why the table starts at .20 in this case).
Charles
Hi Charlie,
Whether there is a significant difference depends on the alpha value (i.e. significance level) that you choose. Generally, this is set at 0.05. .20 doesn’t mean that there is an 80% chance of accepting the alternative hypothesis.
With a sample of only 3, you can’t expect the test to demonstrate much. In fact you can’t get a significant result for alpha = .05 or .10 (which is why the table starts at .20 in this case).
See Null and Alternative Hypothesis for more information.
Charles
I wanna know the critical value, but my samples are: n1=88, n2=137. These values are not found in the table, can anyone help me with this?
Hello Youssef,
With such large samples, you should use the normal approximation as described at
https://real-statistics.com/non-parametric-tests/mann-whitney-test/
and not use the tables of critical values.
Charles
Thanks Charles,
I already solved it using SPSS. Using Excel to do it is quite fun, but for quick results SPSS is better.
Is there any way to make an account on your website?
Hello Youssef,
What do you mean by “making an account”?
Charles
to be a member in this website, receive updates news about your works
Hello Youssef,
You can follow Real Statistics on Twitter at @Real1Statistics
Charles
Hello again, I have a question regarding the t test paired samples, in order to apply this test the data have to be normally distributed, in my data there are some columns or variables that are not normally distributed, I do not want to exclude these variables because they are very important in my study, what can I do or how to deal with these variables that are not normally distributed?
Thanks in advance
Hello Youusef,
For the paired t test, the differences in values need to be normally distributed (not each sample). If the normality test fails, then you can use the Wilcoxon Signed Ranks test. This is described on the Real Statistics website.
Charles
Hi there,
If my n1 =24 and n2=24, how will I find my critical value? I’ve seen that you’ve mentioned the use of normal approximation for larger values, but is there a way to not use normal approximation? Thanks!
Victoria,
You can use the Mann-Whitney exact test. This is how I created the table of critical values.
Charles
Is it possible to get N1 or N2 as a decimal ? If yes then how to check the table
Rima,
It is not clear to me what a non integer value for N1 or N2 would mean, but you can always use interpolation for values between two values in the table.
Charles
I want to know what will be the decision for the statistical data U=31 and cv = 29? Is the null hypothesis rejected or not?
Olive,
See https://real-statistics.com/non-parametric-tests/mann-whitney-test/
Charles
Hello,My name is Asmar. my question is i want to make a comparison of before and after metro bus on the property values and on the different area property values. Before year 2009-13 and after year 2013 to 2016.i want to make a comparison.i use man Whitney test but i check the shapes of the two samples using histogram also taking difference,but the shape of the two samples are not identical not symmetrical.to perform the test i use Minitab software .can i use Mann Whitney test to compare the values?even the shapes are not same? also here it is suitable measure or not? also brief me the conditions how use Mann Whitney test what are the assumptions? My sample size is so small.i have 4 values before and 4 values after metro.also can u please suggest me some to compare control and catchment areas? remember my sample size is so small.Please help me.
Asmar,
The Mann-Whitney test requires that the two samples be independent, which is probably the case for properties in different areas. But if you are comparing the values of the same properties before and after, then this assumption is violated, in which case you should consider using the Wilcoxon signed ranks test (or even possibly the paired t test).
With samples of size 4, it is not surprising that the shapes are different. In any case, you shouldn’t expect too much from any test that you use since the samples are not likely to sufficient capture the properties of the populations from which they are drawn.
In any case, if you use the Wilcoxon signed ranks test, you are only concerned about the properties of the differences between the values. If these differences are roughly symmetric, you can use this test (or even the paired t test.
Charles
How hard is it really to provide a two parameter Taylor series for the U-statistic so we don’t have to waste time looking up values in tables? Gheesh.
Jon,
You don’t have to use the tables now. You can use the normal approximation with larger samples or the Mann-Whitney exact test with smaller samples. Both are available now with the Real Statistics Resource Pack. The table lookup is also automated using the MCRIT function. In the next release of the software, support for the exact probabilities will be enhanced (larger samples, much faster speed).
May I use the Test for 2 groups of 3 samples each? Which is the minimum size of the samples? I need a p value .05.
alpha value is like p value?
Thanks
Sissi,
The table doesn’t handle such small samples. With such small samples, you shouldn’t expect much from the test anyway. Did you try using a t test?
Charles
How to see the the critical value in table ?
In 0.05 confidence level
Use the table for alpha = .05 and find the value in the table for the sizes of the two samples (n1 and n2).
Charles
I hv two samples and the df1=24 and df2=24.
please Could you tell me how to get the Sig (2 tailed)
given confidence level of 0.05
Faith,
With values this high, you don’t need to use a table of critical values. Instead you can use a normal approximation. This is explained on the following webpage:
https://real-statistics.com/non-parametric-tests/mann-whitney-test/
Charles
I have two samples which have the df 24 for the first group and 24 for the second group. and I hv calculated the t-test for each item. pls Could you tell me how to get the Sig (2 tailed)
given confidence level as 0.05
Faith,
I don’t know what you mean when you say that you have “the t-test for each item”. Are you using a t test or the Mann-Whitney test?
Charles
hi is it possible to use this when I have more than 20 samples?
I have 59 samples for T1 and 58 samples for T2
Ezekiel,
For this sized sample, you don’t need to use a table. Instead you could use the normal approximation as described at
Mann-Whitney Test
Charles
Yes.
Charles
Hi. I have a very small sample size of five divided into two groups, n1=3 and n2=2. I have already computed for Ua=0 and Ub=6. How will I know the P(1), P(2), critical intervals for Ua (lower and upper limit)?
Ramon,
The fact that there are no values in the table indicates that you can’t really perform a meaningful test with such small samples.
Charles
Hi, I’m struggling to understand how to calculate approximations for Ucrit when n1=21 and n2=24 ????
Abby,
You won’t be able to since these values are outside the range of the table. For values over 20, generally you wouldn’t us the table, but would use the normal approximation instead. See the following webpage (esp. Example 2)
Mann-Whitney Test
Charles
How do you know that the alpha value for your data is?
Chelsea,
Generally alpha is set to .05. See Null and Alternative Hypothesis for more details.
Charles
Hello,
is there any minimum sample size to perform the mann whitney u test? can I do the test with sample size n1=n2=2?
Thank you
Atika,
With such a small sample, the power of the test is bound to be very low. E.g. if I estimate the power of the MW test by using the power of the t test, I see that the power for the test with effect size .5 is only 6%. Even with a huge effect size, you can’t expect much with such a very small sample. You can find out more by using the Statistical Power and Sample Size data analysis tool or G*Power.
Charles
Hi, what is the critical value if n1=11 and n2= 29? Thank you!
Alyssa,
For samples this large you can use the normal approximation as explained on the following webpage instead of using the table, which usually only goes up to n = 20.
Mann-Whitney Test
Charles
Thanks! 🙂
can any of my u values have a decimal point like 2.5 or did i do something wrong in my calculations
Stewart,
They can be whole numbers or numbers that end in .5. A value of 2.5 doesn’t mean that you did anything wrong.
Charles
Is the default to Reject or NOT Reject Ho if the Test Statistic and the Critical Value are equal?
I find some textbooks are not clear in such cases.
This is not clear to me either. I have typically considered p < alpha as reject and p = alpha as not rejection of H0, but others may disagree. In any case since even the value for alpha (typically .05) is rather arbitrary, it probably is not that important. Best is to say the test is borderline. Charles
Hello
I am applying Man Whitney U test to identify the significance difference in ranking of some factors by two different groups
can i show the results to be significant if Alpha less than 0.05 but there is huge difference in sample sizes. e.g. for group 1 it is 33 and group 2 it is 7 ….or group 1 = 33 or group 2 = 2.
Please let me know ..also i cannot find U values of sample size of 33
i will be grateful.
You can use the Mann-Whitney test even when the group sizes are not equal.
The critical value when n1 = 33, n2 = 7 and alpha = .05 is 60.
In general for sample sizes larger than 20, the normal approximation is used and so you don’t need to have values from the table of critical values. You can find more information about this at the webpage
Mann-Whitney Test.
Charles
Thanks for your page. What would be the critical value for n1=22 and n2=20? Btw, if I can ask, how do you get it?
Cheers
The critical value for n1=22 and n2=20 is 141. This comes from an extended table of critical values which I haven’t yet put on the website.
Charles
Thanks for the reply.
I got that the null theory is not valid, so the two variables do not behave equally. How can I determine the directionality of the data?
If by directionality of the data, you mean which sample is larger, you can compare the medians of the two samples or the rank sums of the two samples.
Charles
If n1=30 and n2=30 is there a critical value for mann whitney
Sorry Anne, I don’t have a table value for n1=30 and n2=30, but the normal approximation described on the following webpage should be pretty accurate.
Mann-Whitney Test
Charles
OK I see my mistake now……………………silly me. Please withdraw my question. Thanks again
Thank you for the useful table. I have rather a basic question, apologies.
Lets take the case where n1= 20 and n2 = 20. The critical value for two tails is 97 and 105 for alphas of 0.05 and 0.01, respectively. Lets say I come up with a t score of 100 does that mean that I cannot reject the null at a 95 % confidence interval, but can at a 99 % confidence interval? This seems a bit perverse to me and I am sure that I am going wrong somewhere. Please help.
Hi!
How are this critical value computed? They’re empirically determined or there is an exact formula?
Thanks
Hi Elena,
The critical values come from tables that were calculates many years ago and can be found in multiple references. I believe they were created from the exact formulas, similar to the ones I have described on the website.
Charles
Hey! I really do like your wed site as it is so well done. I hope you could answer my question as I can’t find a answer to it by googling. Could you tell me where does this numbers come from? Is there a formula to calculate these or it this from some kind of distribution or density function? I would like to know the density function or the function as I just can’t understand where the numbers come from. Could you help me, please?
Katri,
The table is related to the Mann-Whitney exact test. See Mann-Whitney Exact Test for details.
Charles
what about if n1 = n2 =36 (alpha = 5%, two-tailed test)
Sorry, but I don’t have table values when both n values are so high. It is best to use the normal distribution approximation in this case.
Charles
What about if n1 =8 and n2=30 (alpha = 5%; two-tailed test)
Julia,
The critical value is 65 for n1 = 8 and n2 = 30 (alpha = 5%; two-tailed test)
Charles
I can’t find a mann whitney u chart for an experiment in our range. We’re looking for the test statistic when n1 is 34 and n2 is 26 and I believe one tailed.
Tom,
Generally the tables end with n1 = 20 and n2 = 20. When one or both of these are larger than 20 you should use the normal approximation as explained on the webpage Mann-Whitney Test.
Charles
if test statistic for the mann whitney test is T= S – [{n1(n1+1)}/2]
then for the following critical region
Reject H0 if
T w(1-∝/2) { where w(1-∝/2)= n1*n2 -w(∝/2)}
kindly guide me for the critical values table.
if n1= 17 and n2=10 and S = 296.5 where S is the sum of ranks of ist sample
The critical value for a two-tailed test with n1 = 17, n2 = 10 and alpha = .05 is 45. The critical value table does not use S.
You need to compare the critical value with U = min(U1, U2) where U1 and U2 are as defined on the webpage Mann-Whitney Test. Here S is equal to R1 in the definition of U1.
Charles
At least, it looks like there are some mistakes in your tables
My computations (and checking others tables) seem to show that for the table 0.05
the element (20, r4) and its symmetric are 14 and not 13
Pilou,
You are absolutely correct. Looks like a miscopied this value. I have corrected the value on the referenced webpage and in the software. I have also added two more Mann-Whitney tables to the referenced webpage (for alpha = .005 and alpha = .20). Thanks very much for catching this mistake. Did you find any other mistakes in the tables?
Charles
What is the critical value for the Mann-Whitney test for sample sizes of n1 = 1000 and n2 = 1000?
Prin,
For such large samples you need to use the normal approximation instead of the table. How to do this is described on the webpage https://real-statistics.com/non-parametric-tests/mann-whitney-test/. Property 2 shows the normal approximation. You can also use the T Tests and Non-parametric Equivalents data analysis tool (choose the independent samples and non-parametric options) to calculate the critical value.
Charles
sorry !!
previous post failed !!
My question is : if n1 =5 and n2=30 (alpha = 5%; two-tailed test) what is the critical value for the Mann-Whitney test ?
The critical value for the Mann-Whitney test when n1 = 5 and n2 = 30 (alpha = 5%; two-tailed test) is 33.
Charles
Good afternoon from Spain and sorry for getting into this conversation…
I would like to know, it is really posible to obtain reliable results with these n1= 5 and n2= 30? If yes what are then the reliability Limits of Man-Whitney regardir small sizes of sample sets
Javier,
It depends on what you mean by reliable results. You can certainly use the Mann-Whitney test on samples of size 5 and 30 and based on the table, you should be able to get pretty accurate test results (e.g. to test whether the medians are equal) provided the assumptions are met.
With small samples, the concern is whether the test has sufficient power to detect small differences. See
Power Mann-Whitney
Charles