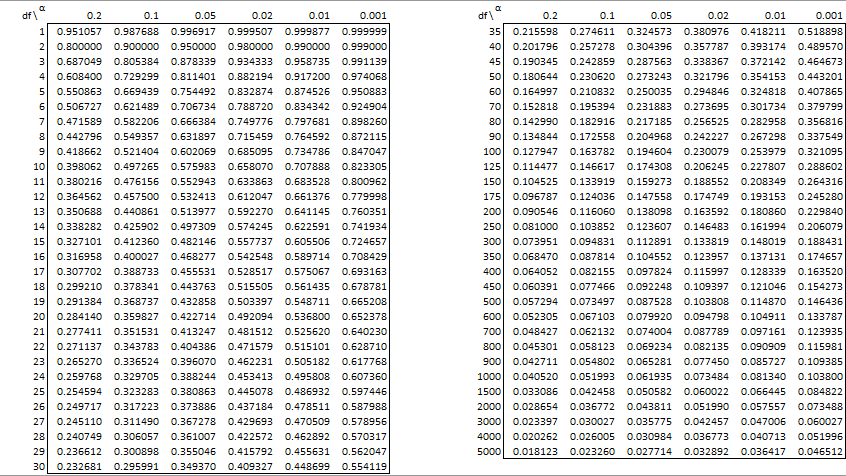
The table contains critical values for two-tail tests. For one-tail tests, multiply α by 2.
If the calculated Pearson’s correlation coefficient is greater than the critical value from the table, then reject the null hypothesis that there is no correlation, i.e. the correlation coefficient is zero.
See Hypothesis Testing for Correlation Coefficient for details.
Links
Download Table
Click here to download the Excel workbook with the above table.
Reference
Aspelmeier, J. (2005) Table of critical values for Pearson’s r
https://pdf4pro.com/amp/view/table-of-critical-values-for-pearson-s-r-59198f.html
for a sample size of 133 how to create this table?
Hello,
1. You can interpolate between the n = 125 and n = 150 lines in the table. How to do this is described at
https://real-statistics.com/statistics-tables/interpolation/
2. Alternatively, you can use the PCRIT worksheet function provided in the Real Statistics software, as described at
https://real-statistics.com/correlation/one-sample-hypothesis-testing-correlation/correlation-testing-via-t-test/
This webpage actually suggests how to build the table of critical values (including those not included in the table on the website).
3. You can ignore the table of critical values all together and calculate a p-value using any of the techniques described at
https://real-statistics.com/correlation/one-sample-hypothesis-testing-correlation/
Charles
Good morning, am trying to run a reliability test for a test retest. Is Pearson correlation enough?
Probably yes if you are testing and retesting all scores. If not see:
https://real-statistics.com/reliability/internal-consistency-reliability/split-half-methodology/
Charles
Hello Charles,
I have a data sample of more than 8500. I would like to use Pearson’s significance table, yet it stops at 5000. Any help on this?
Regards.
Hello Moses,
Instead of using the table, you can use the procedure described on the following webpage. This works for any value of n, including those greater than 5,000.
https://real-statistics.com/correlation/one-sample-hypothesis-testing-correlation/
Charles
Respected Sir,
I am a research student and I have different correlation values like 0.4255, 0.4822, -0.2861 for atmospheric models and the number of records or the df values are 30 as the data is for 30 years and I want to do the significance student t-test that how much significant the values are either by 90%, 95% so on…? Please do guide me in this regard.
Hello Praneta,
Do you have the data that was used to calculate the correlation values 0.4255, etc.?
See https://real-statistics.com/correlation/one-sample-hypothesis-testing-correlation/correlation-testing-via-t-test/
Charles
Yes Sir, it is the CMIP6 data for correlation used between sea surface temperature and precipitation for the NINO region for last 30 years.
You should be able to use the approach described at
https://real-statistics.com/correlation/one-sample-hypothesis-testing-correlation/correlation-testing-via-t-test/
Charles
Sir, What will be the critical value for 120 respondents? Same as for 125, as mentioned in the above table?
Hello Haide,
You need to interpolate between the values for 100 and 125. The resulting value will be only a little different from the value for 125 (since 120 is close to 125). You really need to use the table at all since there are other approaches (see https://www.real-statistics.com/correlation/one-sample-hypothesis-testing-correlation/).
Charles
how to compute is df= 208?
I suggest one of the following two approaches:
1. You can interpolate between df = 200 and df = 250. See
Interpolation
2. For samples this large you don’t really need to use the table. See
https://www.real-statistics.com/correlation/one-sample-hypothesis-testing-correlation/
Charles
Hi, just to check, the values in the table are the |r| values right?
Hi John, yes that is correct.
Charles
Can one calculate the product moment coefficient by only given the significance level and sample size? If so what is the equation?
Hello Owen,
I haven’t thought about this issue previously, but I doubt that the significance level and sample size are sufficient to calculate the correlation coefficient.
Charles
I have a population sample of 341. What will be my critical Values for Pearson’s Correlation coefficient?
You need to interpolate between the tables values for 300 and 350. See the following for details.
https://real-statistics.com/statistics-tables/interpolation/
Actually with such a large sample you don’t need to use the table at all. Instead you can use the approach described at
https://real-statistics.com/correlation/one-sample-hypothesis-testing-correlation/
Charles
How to get if df is 38?
Hello Aby,
You need to interpolate between the values 35 and 40. This is explained at
https://www.real-statistics.com/statistics-tables/interpolation/
Actually, you don’t really need this table at all if you use one of the techniques described at
https://www.real-statistics.com/correlation/one-sample-hypothesis-testing-correlation/
Charles
You say –
“The table contains critical values for two-tail tests. For one-tail tests, multiply α by 2”
I think it should be divide by two – unless i have missed something there ?
Charles,
For the critical values, you multiply by 2.
Charles
Thanks for the reply. To save me going into a long explanation of tails – I give this popular example – the first hit on the internet for this table – https://www.statisticssolutions.com/free-resources/directory-of-statistical-analyses/pearsons-correlation-coefficient/table-of-critical-values-pearson-correlation/
(I wanted to inlcude a picture, but seems not possible).
You will see that the probabilities for one tailed in this table are half the probabilities for two tailed. Thus I agree with your table – and the comment that the table contains values for two tail – but for one tail it should be halved, not doubled.
Hi Charles,
The example you sent me seems to support the conclusion that the alpha value for a one-tailed test is half that for a two-tailed test, but let me suggest another example that supports a different conclusion.
1. The example is a t-test based on two independent samples of size 4 with the t-stat = 2.09477. We use a significance level of alpha = .05
2. For the two-tailed test the p-value = T.DIST.2T(2.09477,6,TRUE) = .081062, which indicates a non-significant result.
3. For the one-tailed test the p-value = T.DIST.RT(2.09477,6,TRUE) = .040531, which indicates a significant result. In general, the p-value for the one-tailed test is half that of the two-tailed test. It is always easier to obtain a significant result with a one-tailed test compared with a two-tailed test.
4. We now perform the same test using critical values instead of p-values. For the two-tailed test the t-crit = T.INV.2T(.05,6) = 2.446912, which indicates a non-significant result since t-crit = 2.446912 > 2.09477 = t-stat.
5. If the critical value for the one-tailed test is the same as the critical for the two-tailed test with alpha divided by 2, we would get t-crit = T.INV.2T(.025,6) = 2.968687 > 2.09477 = t-stat, and so once again we see that the result is not significant, which contradicts the result we got using the p-value.
6. If instead, the critical value for the one-tailed test is the same as the critical value for the two-tailed test with alpha multiplied by 2, we get t-crit = T.INV.2T(.1,6) = 1.94318 < 2.09477 = t-stat, and so the result is significant, consistent with the result we got using the p-value. 7. Finally, note that the formula for the one-tailed critical value in Excel is T.INV(1-.05,6) = 1.94318 or alternatively, -T.INV(.05,6) = 1.94318, which the same as the result we got above. Charles
Charles –
Thank you very much for that well considered and thought out answer. It gave me food for thought.
The logic of 2-tail testing, as devised by Mr Fisher, seems to be that if you allow your test to hit either tail, then you increase (double in fact) the p-value of the result you get. You have, of course, a better chance of hitting two targets than one.
Alternatively – the way it’s usually done in the tables – is to share the significance level equally between the two tails, and then use the one tail column of the table. Hence go to the one tail column, but use half the 2-tail significance level.
Already I’m being obliged to admit confusion between halving and doubling.!
Looking at your own results it is interesting to note that
T.INV.2T (0.1, 6) = -T.INV (0.05, 6) = 1.94318
Here we see a halving of the 2-tail probability into the 1-tail.
I fall back on this rather weak defence – simply that the way it is conventionally done in tables is to have two banner lines at the top, with 2-tail and 1-tail probabilities. The 1-tail is always half the 2-tail. The generated tables are for 1-tail really, and then reused for 2-tail.
Indeed, in your own website, you cross reference ‘Aspelmeier, J. (2005) Table of critical values for Pearson’s r’ and if you look at his table, you see he follows this usual convention.
Finally, my own entirely personal comment on two tail testing. I think it is a nonsense. In real life we always have a theory about which way things are going and we use statistics to test it. The idea that we would ever have a test where we have no expectation of a particular type of outcome strikes me as completely unrealistic – and the method of dealing with it somewhat arbitrary.!
However – unfortunately – the examiners love it.!
Charles,
This is confusing, also for me. I have spent a fair amount if time trying to understand what seems like a simple concept. For example, in your comment, you stated that
“Looking at your own results it is interesting to note that
T.INV.2T (0.1, 6) = -T.INV (0.05, 6) = 1.94318
Here we see a halving of the 2-tail probability into the 1-tail.”
Actually, starting from the 1-tailed test, we needed to double alpha (from .05 to .1) and then use the two-tailed test. Note “double”, not “half”. It almost seems like relativity theory: “doubling” becomes “halving” from a different perspective.
Charles
I couldn’t find a reply button for the latest so I’m using this older one. Sorry – I don’t know if you actually wanted to bring this conversation to an end – quite understandable if you did.! (If we did want to continue, we could use email – to avoid cluttering your website with all this stuff.)
Charles.bowyer@hotmail.co.uk
I agree you are right to say that using excel to get a 1 tail value from a 2 tail test you need to double the probability. I think that excel then halves the probability given, and uses 1 tail.!
And of course halving is doubling from a different perspective.! It’s just the direction of travel. Go one way it’s halving, go backwards it’s doubling. I just do think that it would be less confusing if your website followed the widespread convention for how the r values are tabulated and tested…?
By the way – thank you for your answers. I have enjoyed the discussion – and it has made me think !!
What if the calculated value and table is values is the same, those it reject or accept Null hypothesis
Allen,
It is borderline. Since the alpha value is somewhat arbitrary anyway (even if it is usually set to .05), you are probably ok deciding either way. Technically, though, if p-value = alpha or calculated value = critical value, then you reject the null hypothesis.
Charles
What if my data frame has 80,000 rows of data?
You don’t really need to use the table in this case. Instead, you can use the test as described at
https://www.real-statistics.com/correlation/one-sample-hypothesis-testing-correlation/correlation-testing-via-t-test/
Charles
Hi Mr. Charles, i want to ask you.. if our df is 273 what is our critical value? thank you
NB: sign = 5% or 0.05
Hi Ticha,
You can interpolate between the 250 and 300 values from the table, which yields a value near .118.
Better yet, you don’t really need to use the table at all. You can use the t-test described at
https://www.real-statistics.com/correlation/one-sample-hypothesis-testing-correlation/correlation-testing-via-t-test/
Charles
what if n value is between 2000 and 3000
You can interpolate between the values in the table as explained at
Interpolation
Alternatively, you can use one the tests described at
https://www.real-statistics.com/one-sample-hypothesis-testing-correlation/
Charles
Hi if our df is 48 what is our critical value?
You need to interpolate between the 45 and 50 values. See Interpolation
Charles
I am trying to formulate an index based on addition of a few relevant variables (i.e. ratios of actual/reference condition). Is there any system of assigning weightage to different variables as all of them may not be equally influencing the index ? For ex. if a variable is very much influencial, I assign 1 (unity, like a perfect correlation coefficient) to the variable or ratio, making the value of variable unaltered. But, if a variable is low or moderate in importance, what weightage should I assign ? The weightage must be <1 and after assigning (or multiplying with) the weightage, the variable would reduce in value so that its influence to the index gets lower, justifying its lower importance. If I am right in my above assumption, exactly what should be the values of low and moderate weightages and based on what logic ? I hope I am clear ?
What if my df= 38 but in the table there’s none how will I know what is my critical value
You can interpolate between the 35 and 40 values. See
Interpolation
Charles
Hi Mr. Charles,
How many decimal places should I use for the t critical and t computed?
Kaylie,
I suggest that you use all the decimal places you can for all the data values. Only at the end should you round off. The number of decimal places is usually determined by the journal you are publishing in or the needs of your audience.
Charles
Hello Mr .Charles.
How can I do the pearson’s correlation cofficient of the research question,what is the level of relationship between competencies in pedagogical knowledge and current teaching practice displayed by Governmental and private pre-school teachers
Hello Mohamed,
You can use Excel’s CORREL function. See
Basic Concepts of Correlation
Charles
Hello, Charles.
If I have an 20 results from 20 differents laboratories and each laboratory tested 3 times 4 similar specimens. What would be my df? Is-it 20 -(3-1)(4-1)? thx!
Cyril,
What hypothesis are you testing and how does this relate to the Pearson-s Correlation Table_
Charles
Hello Charles,
Is there a statistical test to interpolate or is it just based off which number is closest?
Regards,
Joe
You can use interpolation. See Interpolation.
Charles
Hi, Charles,
If N=16 and I have tested them in 3 conditions for a total of 168 conditions with 2 repetitions (i.e., total entry = 336 for the whole correlation data set), what would be my df?
Thanks much!
What hypothesis are you testing?
Charles
The correlation between two percepts tested in 3 locations with repeated measures.
That is not a hypothesis.
Is your hypothesis that this correlation is zero?
Charles
Yes.
What’s the df then?
Thanks so much and happy holidays!
df = n-2 where n = the size of each sample.
Charles
Hello, Charles. If I have an n of 628, two-tailed. What would be my df?
df = 628-2 = 626
See https://real-statistics.com/correlation/one-sample-hypothesis-testing-correlation/correlation-testing-via-t-test/
Charles
Hello Charles. Thank you for the clear explanation! However, if I have R^2 = 0.2 for dof = 400 does it mean (according to the table of critical values) that there is a correlation between two values? In other words, does rejection of null-hypothesis that there is no correlation makes me able to claim that there is correlation? Thank you.
Hello Maksim,
The null hypothesis is that the correlation is zero (i.e. “there is no correlation”). If the test rejects the null-hypothesis, then you are 95% confident that there is a correlation (assuming that alpha = .05). When using the table of critical values, remember that R^2 does not represent the correlation. The square root of R^2 represents the correlation, which in this case is .4472.
Charles
What will be the critical value for n=66, r=.750 and sig. lvl =0.01?
You need to interpolate between the table values at n = 60 and n = 70 where alpha = .01.
Charles
Hi Charles, what will be the critical value at n = 284, tails = 2, alpha = .01?
You can interpolate between the n = 250 and n = 300 values in the table.
Charles
Thanks for your explanation here. In addition, can you present this in a table with a hypothetical case?
Hi Hillary,
See https://real-statistics.com/correlation/one-sample-hypothesis-testing-correlation/
Charles
what will be the table value for 48 sample size and at sig level 0.05 if r = 0.2715
The critical value at n = 48, tails = 2, alpha = .05 is .284519. You can interpolate between the values in the table at 45 and 50. Alternatively, you can use the Real Statistics PCRIT function.
Charles
Is there an excel formula for the calculation rather than using this table?
Hello Tisha,
Yes, see the following webpage
https://real-statistics.com/correlation/one-sample-hypothesis-testing-correlation/
Charles
very happy for visiting ur website. thank u
Hello Mr. Charles,
I am happy to see such a good site having good explanation of important statistical tools.
Really helpful for researchers.
Congratulations to you sir.
Hello Mr. Charles,
Hello, Mr. Charles. If I have an n of 231 two-tailed. What would be my df and its tabular value using the pearson r?
Reply
Hello Jean,
df = 231-2 = 229.
You need to interpolate between the 200 and 250 values in the table or you can use the Real Statistics PCRIT function.
Charles