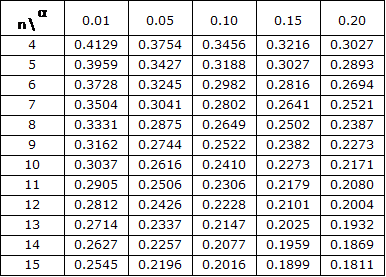
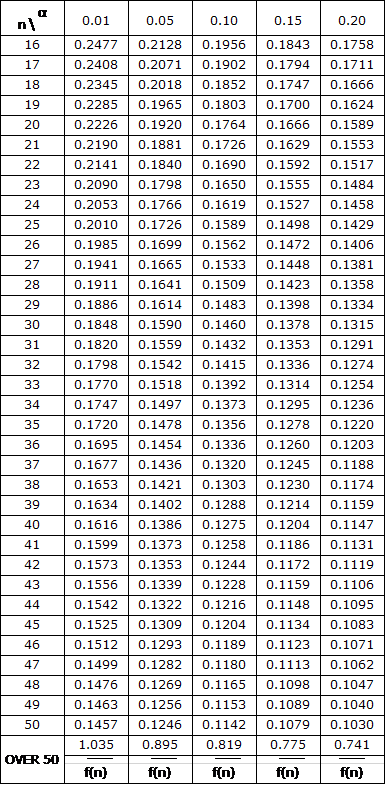
These tables give the critical values Dn,α for the Lilliefors test for normality, as described in Lilliefors Test. The first table is the original table from Lilliefors, while Table 2 is a revised version from Abdi and Molin.
Table 1

Table 2
where ![]()
Links
Download Table
Click here to download the Excel workbook with the above table.
References
Abdi, H. & Molin, P. (2007) Lilliefors/Van Soest’s test of normality. Encyclopedia of measurement and statistics. Neil Salkind (Ed.). Sage, Thousand Oaks, California
https://www.utdallas.edu/~herve/Abdi-Lillie2007-pretty.pdf
Lilliefors, H. W. (1967) On the Kolmogorov-Smirnov Test for Normality with Mean and Variance Unknown, Journal of the American Statistical Association, Vol. 62, No. 318, pp. 399-402.
https://pdfs.semanticscholar.org/4aad/1756e88dba86399a75891895e00b160f5460.pdf
1. Perform a normality test on the following data using Lilliefors Formula:
70 55 80 75 75 70 60
See https://www.real-statistics.com/tests-normality-and-symmetry/statistical-tests-normality-symmetry/lilliefors-test-normality/
Excuse me sir, how about if my sample only use 3 data? Because the littlest point is only 4. Is my data wrong?
Or, how to calculate critical value of liliefors table?
If your sample only has 3 elements you can use Shapiro-Wilk test to test for normality, but no matter what test you use, the result will be very problematic with such a small sample. This doesn’t mean that your data is “wrong”, only that it will be difficult to perform some of the tests with such a small sample.
Charles
Okay, thank you sir for your information
For n=1000
My program
2E4 samples
___________1%_____________5%_______
_________0.0335__________0.0287
_________0.0332__________0.0286
_________0.0334__________0.0286
_________0.0331__________0.0285
_________0.0333__________0.0286
2E5 samples
________0.0333__________ 0.0286
________0.0333__________0.0286
Since Abdi 0.0327(1%), 0.0283(5%)
I am fully satisfied in what concerns 5%, not so much for 1% significance.
Note
on request, I would be happy to display here the program listing,
corrected now, in order to be cross- validated.
Luis
_______My_____________#samples
_______________________/size
_n___alpha=.01____.05________________.01______.05__
After bug corrected my values and those from Abdi [1] are in accordance
(I will provide my routine on request)
_____________MY______________________Abdi & Molin____1E5
__________.01____.05_____#samples/size_.01______.05___alpha
_50______.1450___.1245______4E6______.1457____.1246_
_100_____.1036___.0889______________ 1026____.0888_
_150_____.0850___.0729______________.0840____.0727_
_200____ .0738___.0633______________ .0729____.0630_
_250____ .0662___.0567____1E6_______ .0652____.0564_
_300____.0605___.0519____4E5_______ .0596____.0515_
_400____.0525___.0450_____________ .0516____.0447_
_500____.0471___.0404_____________ .0462___ .400_
[1]- Hervé Abdi, Paul Molin, Lilliefors/Van Soest test of normality
I apologize to all.
Either the explicit CV´s as the fitting formulas Abdi display are correct. My critics concerning the latter are wrong. In fact, a “bug” was caught at the ratio u(j+1)/u(j) affecting the conversion normal rv into p-value.
My soundest apologies (I feel ashamed, true)
Forget me
Luis
Charles
Would you to eliminate my 2 last posts?
Thanks (I will recalculate from the fresh…)
Luis
Luis,
Ok. I have done as you requested.
Charles
Could we have an idea how much fine work was unduly spoiled owing to the erroneous extreme CV´s Abdi formulas provide?
It is urgent to find somebody, not “Anonymous”, influent at Papers Editors, available to warn the Scientific/Technical society about this issue . . . (I would say).
Charles
The problem had neve been the incorrectness in the CV values
Abdi displayed. They are correct as long I know, in the range 4(1)50.
However, when the Authors, willing to expand the values, they provide
the formulas at the bottom of each column (significance) they were
absolutely ridiculous because the fitting fails soon or latter (in case for n>100)
when we go to further values of the independent variable n.
Did I be clear this time?
Thank you for clarifying this.
Charles
What seems to have happened is that Abdi & Morin [1], apparently following what Kolmogorov-Smirnov did, after obtained the simulated C.V.´s, 4(1)100, fitted them through a smoothing equation that they supposed it be true for whatever high size. Unfortunately, they were wrong as I could find through a Monte Carlo routine I had made myself. No harm, if we limit to “not greater than 100” the sample sizes.
In fact
__________Simulation___Abdi&Morin
100________.0890_______.0890__
105________.0869_______.0868__
110________.0851_______ .0849__
115________.0834_______ .0830__
120________.0819_______.0813__
125________.0806_______.0797__
130________.0795_______.0782__
135________.0785_______.0767__
140________.0775_______.0753__
145________.0768_______.0740__
150________.0761_______.0728__
If I understand correctly, I believe that you are saying that the Simulation values are more accurate than the ones labelled Abdi&Morin. Is this correct?
Charles
WARNING!
Lilliefors Test for Normality
To all Lilliefors Test users evaluating CV (95% confidence) through
f_n = (.83+n)/√n-.01 , CV(n=100,.95)=.896/f_n
Comparing with simulated values
Critical Values
n Simulation Formula
50 .1245 .1248
100 .0890 .0890
150 .0761 .0728
200 .0728 .0631
250 .0721 .0565
DO NOT use for sizes n>100, it goes worse and worse whith growing sizes . . .
Random Events Engineering?
Charles (not to be published if you think so)
Indirect “proof”
Through the window, at home, I cannot see the drops falling. However I observe that people their umbrellas unfolded, if they do not carry them walking unusually fast.
Then, I assume that most likely, is raining.
Data processing uses similar procedure, by “symptoms”, to find out the statistical procedure fitted to data treatment. Very rarely we have a deductive mathematical inference. This leads me to the conclusion “Statisticians ARE NOT Mathematicians”.
Luis
Charles
When a person gets old tends to turns out his beliefs to certainty, I dread. Let be the Jacob Cohen “The Earth is Round (p<0.05)” specifically of a syllogism the author found (Pollard, Richardson, 1987).
__1(A)- If a person is an American, then is probably not a member of the Congress,
__2(A)- This person is a member of the Congress,
__3(A)- Therefore, he is probably not an American.
The conclusion is risible, of course, so J. C. put in confront with the following basic clauses “validating” the NHST,
Conclusion: J.B. states that NHST is invalid . . .
Let´s make comparison
(B)
__If H0 is true then the result (statistical significance) will probably not occur,
__This result has occurred,
__Then H0 is probably not true and therefore formally invalid.
I intend to present two notes:
Note 1
In my opinion (A) is invalid because one condition to fulfil to be a member is precisely to be an American citizen. The conclusion 3(A) is completely senseless.
Note 2
I feel that (B) cannot anyway to be assimilated to a Syllogism. We can get certitude from random events, (B) is simply, not more, not less common sense, I dare.
Would you concede to put this matter under discussion? If you consider it uninteresting/noisy, please do not publish. I do understand. Thanks in advance
Luis
Charles
It could be interesting to you, I guess
influentialpoints.com/…/Kolmogorov-Smirnov_test_.
“ Both the one- and two-sample Kolmogorov-Smirnov and related tests are widely used in all disciplines. Unfortunately, the one-sample Kolmogorov-Smirnov test is commonly misused to test normality when the parameters of the normal distribution are estimated from the sample rather than specified a priori. The result is that the test is far too conservative, and distributions that are clearly not normal are wrongly classified as such*. This practice is perhaps reinforced by a sometimes unconcealed desire to demonstrate normality so that subsequent parametric tests can be carried out **. The situation is not helped by various software packages being unclear about which test is being used. The correct test to use to test for normality when the parameters of the normal distribution are estimated from the sample is Lilliefors test.*** “.
Luis
My notes
* Because the Critical Values are much larger than the corresponding (size, level) ones relative to the Lilliefors Test.
** Psychology = Normal against abnormal
*** The POINT!
Charles
In preference it was wiser to ask to a genuine expert to comment your text. The only thing I am able to provide you is my opinion, which I do with pleasure.
Though I was my duty I would eliminated the term improvement
(I know, it appears persistently in the context). Why? In my opinion, you know, one-sample KS and Lilliefors are two different tests in spite of using the same (test) statistics, namely the maximum difference between the Normal Distribution Function and the Empirical one provided by the data.
In preference I would stress the differences rather than similarities. Such that
___ KS test intends to find if data is likely to follows a normal law to which the parameters (mean, standard deviation) are given beforehand, contrarily to Lilliefors test, aiming the same goal but both parameters are estimated from data.
Dear Charles, what I said is not but babbling, you know?
Luis
Lilliefors test for normality
“When the population mean and standard deviation for the One Sample Kolmogorov-Smirnov Test for Normality is estimated from the sample mean and standard deviation, the results are not very accurate. The Lilliefors Test corrects the KS Test in such cases, and so provides a much more accurate test for normality. The calculation of the test statistic is the same as for the KS test, but the Lilliefors test uses a different table of critical values.”
______My nightmare comes true . . .
I will not repeat that they are different tests (with similar test statistics).
Luis,
Is it correct to say the following?
The Lilliefors Test is an improvement over the KS Test in such cases, and so provides a much more accurate test for normality. The calculation of the test statistic is the same as for the KS test, but the Lilliefors test uses a different table of critical values.”
Charles
Risking to be taken as a know-all guy
(appealing to your amicable patience Charles, this is a strictly personal cry)
Things that I hope to find no more from Statistical literature:
___The Lillefors Test is a Kolmogorov-Smirnov´s correction. They use the same test statistics, sure, but are based on different assumptions namely the latter suppose that the normal parameters are known, the former, contrarily, should be estimated from data.
journals.ametsoc.org › JAM6282 › December 1975
___ Critical values displayed with more than 3 decimal places when simulated data derived from 100´000 samples each size or less.
Just above the table show a misprint
_____________n=30, alpha = 0.05, Abdil & Molin cv=0.1590 (my value 0.159)
Luis,
Thanks for finding this typo. I will update the table shortly.
I appreciate your help in making the website (and the software) more accurate.
Charles
Charles,
I dare . . . to suggest that people using the Table should be warned that the 4th decimal places (Abdi and Molin) strongly problematic. Do you agree?
Note that they used 100000 samples, I two times that number, and the values varied from those I found mainly by +/- 0.001 (or less). Sure, sufficient evidence?
Luis
Charles says:
March 24, 2016 at 8:58 am
Charles
I´m very pleased by your concern towards my (unpublished) paper: #1
and #2 are two independent trials, 100´000 samples for each size. Then I performed a LS fitting using this data, then the “adjusted” from the polynomial. Sorry I am unable to provide detailed account because the job was concluded more than 30 years ago, and sorry I do not keep any notes.
Not harm at all. You can refresh your values through
https://www.utdallas.edu/…/Abdi-Lillie2007-pretty.p.
The authors found values that are very close to I did, so you can be absolutely confident about. I invite you to the link I posted:
https://goo.gl/photos/tGo6G64qMVp5CRX79
Luis
Luis,
The Lilliefors distribution function LDIST that is already included in the Real Statistics Resource Pack implements the procedure described in the Abdi and Molin paper that you referenced.
Charles
Mr. Charles,
I have the pleasure to send you my 1994 critical values based on 100000 samples.
Check this link:
https://goo.gl/photos/tGo6G64qMVp5CRX79
Luis
Thank you very much Luis.
How do I use the Exp 1, Exp 2 and Adjusted values_
Charles
Mr. Charles Zaiontz
How could I desagree: the Table you present (with an error) is plainly the oroginal 1967 Lilleifors´one
with “1000 or more” samples for each sample size !!! Could I?
I am waiting you make a revision, please, using a lot larger data. . . is your job!
Luis,
Thanks for your reply. I would be very pleased and honored to use your improved table.
Charles
In complement
As I said two series of experiments were performed. We could state that 60% of the values, for the same size and level, have the three decimals equal, 38% differ from 1 unit at the third decimal, and only one pair out of 115, do have a 2E-3 difference, one pair 3E-3.
Thank you for your reply.
I am not contesting the results displayed under your name, at all. I ask pardon, as you can see my English is rather imperfect
At a time (1990´s) that only original data was available we review the values not basedon “1000 or more samples by size” as in 1967, but twice 100´000, in order to obtain more reliability.
As I could not publish my paper because the Review I sent refused to.
Retired since 1999 I completely loss contact with this business. Days ago, under your name, I did read with joy that the matter did return to concern. Possibly my 1995 values would be possibly outdated, then unuseful.
However if, by chance you are curious, I will send my values I found.
Luís
Thank you very much for sharing this history. It is interesting how these things have evolved. Do you know whether the results you got many years ago are more accurate than the table that I put in the website?
Charles
Mr. Charles Zaiontz
Dear Sir
By the Dvoretzky-Kiefer- Wolkovitz Inequality in order to attain 3 decimal places exacts with a probability “p” or less are
__________________p=0.05 ________________7.4 million simulated samples
____________________0.04________________ 7.8
____________________0.03________________ 8.4
____________________0.02________________ 9.2
____________________0.01_______________ 10.6
I think that all people is aware that tables were constructed with a lot fewer data
than that required to state all 3 decimal places.
Would you so kind to send me your opinion about this point?
Thanks in advance
L. Amaral Afonso
From Portugal, L. Amaral Afonso former senior Investigator Instituto Nacional de Engenharia e Tecnologia Industrial, Lisbon.
Thank you for your observation. Based on your comment, I believe that you are saying that the table included on the website may not be accurate to 3 decimal places (please correctly me if this was not your intention). If you are aware of a table which is more accurate, I would welcome hearing about this.
I have no knowledge about this issue, and in fact don’t use the Lilliefors test. I included this table because some users have asked for it.
Charles