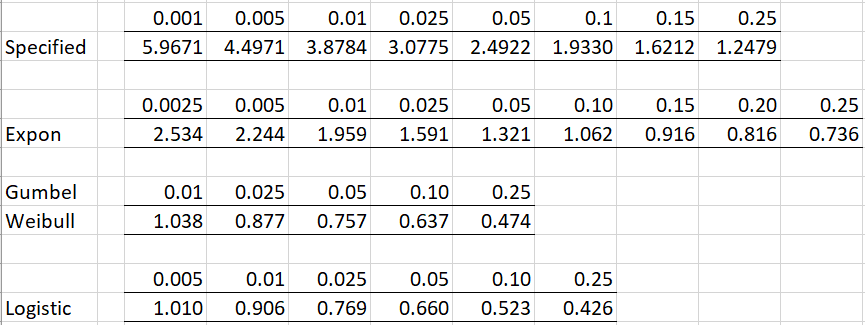
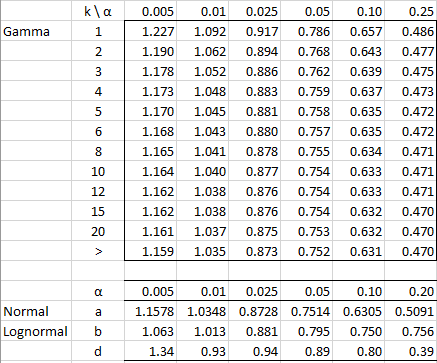
The following tables give the critical values for the one-sample Anderson-Darling test for the specified distributions, as described in One-Sample Anderson-Darling Test.

![]()
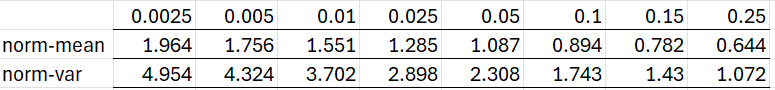
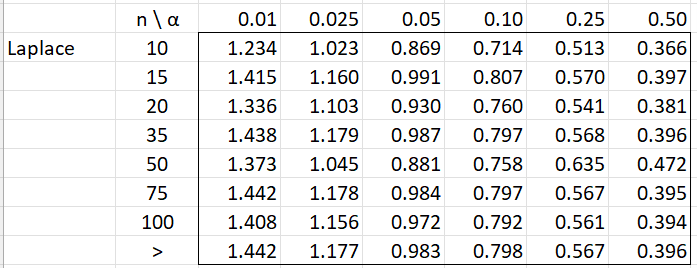
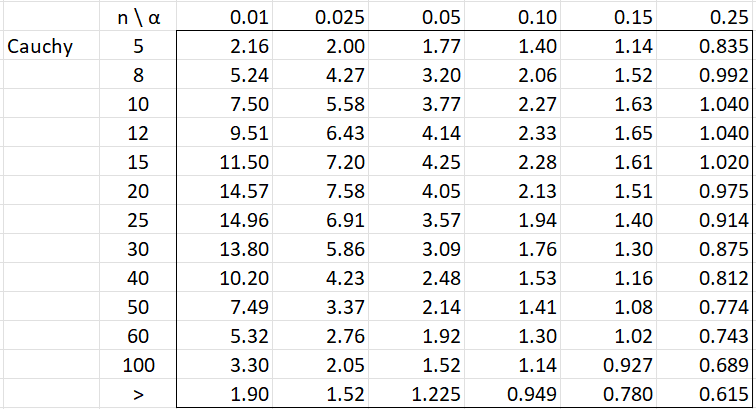
α represents the significance level and n = the sample size.
Note that k in the Gamma table is the distribution’s shape parameter. The symbol > in that table represents a shape parameter > 20. The symbol > in the Laplace or Cauchy table represents a sample size > 100.
Links
Download Tables
Click here to download the Excel workbook with the above tables.
References
D’Agostino, R. B., Stephens, M. A. (1986) Goodness-of-fit techniques. Marcel Dekker, Inc.
https://www.hep.uniovi.es/sscruz/Goodness-of-Fit-Techniques.pdf
Stephens, M.A. (1979) The Anderson-Darling statistic. Technical Report No. 39. Stanford University.
https://apps.dtic.mil/sti/tr/pdf/ADA079807.pdf
Puig, P. and Stephens, M. A. (2000) Tests of fit for the Laplace distribution, with applications
https://nova.newcastle.edu.au/vital/access/services/Download/uon:5419/ATTACHMENT03?view=true
Arshad, M., Rasool, M. T., Ahmad, M. I., (2003) Anderson Darling and Modified Anderson Darling tests for Generalized Pareto distribution
https://scialert.net/abstract/?doi=jas.2003.85.88
Stephens, M. A. (1976) Asymptotic results for goodness-of-fit statistics with unknown parameters. Annals of Statistics
https://projecteuclid.org/journals/annals-of-statistics/volume-4/issue-2/Asymptotic-Results-for-Goodness-of-Fit-Statistics-with-Unknown-Parameters/10.1214/aos/1176343411.full
Dear Charles,
Is there any source to find the critical values of Anderson-Darling test for two shape parameter Beta distribution?
I will thank you in advance for your reply.
Hi Juan,
See the response I just posted to your earlier comment.
Charles
Dear Charles,
I would like to ask you where can i find the critical values of Anderson-Darling for Beta distribution.
Is there any source that i could find them?
I will thank you in advance for your reply.
Hello Juan,
Here are three relevant papers:
https://www.researchgate.net/publication/227206313_Empirical_behaviour_of_tests_for_the_beta_distribution_and_their_application_in_environmental_research
https://hal.science/hal-00544826/document
https://onlinelibrary.wiley.com/doi/full/10.1002/sta4.341
Charles
Where could I find the critical values for LogNormal Distribution to verify?
Hello Paul,
A random variable x is log-normally distributed provided the natural log of x, ln x, is normally distributed.
Thus if you have data x1, x2, …, xn that comes from a log-normal distribution, then ln x1, ln x2, …, ln xn is normally distributed. Thus, you can use the critical values of the normal distribution.
Charles
What would be the critical value when using GEV distribution? I cannot seem to find it in the literature
Hi Paul,
See the following articles:
Jantschi and Bolboaca (2018) Computation of Probability Associated with Anderson–Darling Statistic
Shin et al. (2012) Assessment of modified Anderson-Darling test statistics for the generalized extreme value and generalized logistic distributions
Charles
Hey,
Could you help me please to specify the critical values for GPD (Generalised Pareto distribution)?
Hi Alex,
I will try to add this for the next release. In the meantime, see
Arshad, M., Rasool, M. T., Ahmad, M. I., (2003) Anderson Darling and Modified Anderson Darling Tests for Generalized Pareto Distribution
https://www.researchgate.net/publication/46027298_Anderson_Darling_and_Modified_Anderson_Darling_Tests_for_Generalized_Pareto_Distribution
Charles
Fantastic!
Thanks a lot, I appreciate it 🙂
Alex
Hi, Charles.
on that link, the maximum critical value is at a sample size of 100, what if my sample size is 150?
Hi Acacia,
It is a good question, but I don’t know how to extend the AD test for n > 100 in this case.
Charles
thank you charles 🙂
oh, and.. could i ask more?
on that link, in the statistical equation of the AD test, where did the Z(i) value come from? in my case using stock return data, is Z(i) stock return data or Z(i) theoretical value (stock return data calculated using cdf GPD)?
Hi Acacia,
I don’t see any Z(i) values. Where do you see this?
Charles
When can I use for specified value , e.g Gumble distribution?
Sorry, but I don’t understand your question. Please clarify (even in your native language if English is not your prime language).
Charles
Hi. Might there be a small error in the values for the Lognormal d row? Seems like the values for 0.01 and 0.025 cannot be correct.
Why do you think that these values are incorrect?
Charles
It just seemed odd that the values are in descending order from 1.34 to 0.39, but that they go 1.34 – 0.93 – 0.94 – 0.89… I would expect that the numbers descend regularly, not going down from 1.34 to 0.93 and then up from 0.93 to 0.94
This should not be a problem since the value is determined by a, b and d and not by d alone.
Charles
Dear Charles,
Do you have the critical values for uniform distribution?
Thanks
Rafael,
If the uniform distribution is over the interval (0,1), then the critical values are the same as for the generic case (in fact it is the generic case).
Charles
Dear Charles,
Thanks for the answer. Sorry it bothers you but how should I do if the uniform distribution has limits other than 0 and 1?
Thanks again
Hi Rafael,
If the limits are known, say (a,b), then you can map each value x in this range to a + (x-a)/(b-a). This maps x to a value in the interval (0,1). You can then use the critical values for (0,1).
If the values a and b are not known, then the situation is more complicated and I haven’t yet explored how to use Ander-Darling in this case.
Charles
Dear Charles,
Could I use the maximum likelihood to estimate a and b and then apply you suggestion?
Thanks,
Hi Rafael,
See Fitting Uniform Distribution via MLE for information about fitting a uniform distribution via MLE.
Unfortunately, the table values for the generic distribution is based on known values for a and b. The tables change when the parameters are estimated from the sample data.
Charles
Dear Charles,
I would like to know the formula for testing such critical values for different distribution
Kind regards.
Hello Ahmed,
I don’t know for sure, but probably the values in the table of critical values comes from simulations.
Charles
good afternoon mr
i wonder to ask about shape value
is the different between shapre value and shape parameter for gamma distribution?
k is the shape parameter. See the following webpage:
https://real-statistics.com/non-parametric-tests/goodness-of-fit-tests/anderson-darling-test/
Charles
Excuse me mr charles
I want to ask something
The critical value of anderson darling, is just for 5 distributions above?what about rayleigh distribution sir?
Thank you
Izza,
I don’t have critical values for the Rayleigh distribution.This distribution is the gamma distribution with alpha = 1 and beta = 2. The table contains critical values for this distribution with an unknown shape parameter, but not with a known shape value.
Charles
if i’ve uniform distribution may i use “specified critical value”?
thank you mr charles
It is a great help for me. Thanks for Your work!
Dear Charles,
Many thanks for such precious info.