Basic Concepts
The two-sample Kolmogorov-Smirnov test is used to test whether two samples come from the same distribution. The procedure is very similar to the One-Sample Kolmogorov-Smirnov Test (see also Kolmogorov-Smirnov Test for Normality).
Suppose that the first sample has size m with an observed cumulative distribution function of F(x) and that the second sample has size n with an observed cumulative distribution function of G(x). Define
![]()
The null hypothesis is H0: both samples come from a population with the same distribution. As for the Kolmogorov-Smirnov test for normality, we reject the null hypothesis (at significance level α) if Dm,n > Dm,n,α, where Dm,n,α is the critical value.
For m and n sufficiently large
where c(α) = the inverse of the Kolmogorov distribution at α, which can be calculated in Excel as
Dm,n,α = KINV(α)*SQRT((m+n)/(m*n))
where KINV is defined in Kolmogorov Distribution. The values of c(α) are also the numerators of the last entries in the Kolmogorov-Smirnov Table.
Example (frequency table)
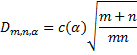
Example 1: Determine whether the two samples on the left side of Figure 1 come from the same distribution. The values in columns B and C are the frequencies of the values in column A.
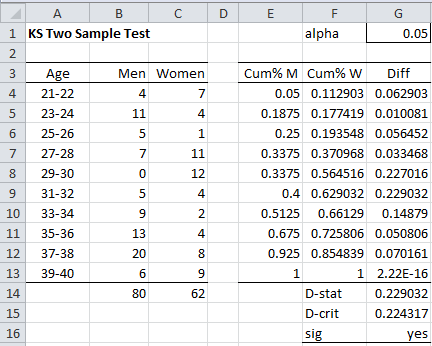
Figure 1 – Two-sample Kolmogorov-Smirnov test
We carry out the analysis on the right side of Figure 1. Column E contains the cumulative distribution for Men (based on column B), column F contains the cumulative distribution for Women, and column G contains the absolute value of the differences. E.g. cell E4 contains the formula =B4/B14, cell E5 contains the formula =B5/B14+E4 and cell G4 contains the formula =ABS(E4-F4).
Cell G14 contains the formula =MAX(G4:G13) for the test statistic, and cell G15 contains the formula =KSINV(G1,B14,C14) for the critical value. Since D-stat =.229032 > .224317 = D-crit, we conclude there is a significant difference between the distributions for the samples.
We can also use the following functions to carry out the analysis.
Worksheet Functions
Real Statistics Functions: The following functions are provided in the Real Statistics Resource Pack:
KSDIST(x, n1, n2, b, iter) = the p-value of the two-sample Kolmogorov-Smirnov test at x (i.e. D-stat) for samples of size n1 and n2.
KSINV(p, n1, n2, b, iter0, iter) = the critical value for significance level p of the two-sample Kolmogorov-Smirnov test for samples of size n1 and n2.
iter = # of iterations used in calculating an infinite sum (default = 10) in KDIST and KINV, and iter0 (default = 40) = # of iterations used to calculate KINV.
When the argument b = TRUE (default), an approximate value is used, which works better for small values of n1 and n2. If b = FALSE, then it is assumed that n1 and n2 are sufficiently large so that the approximation described previously can be used.
For Example 1, we have the following:
D-crit = KSINV(G1,B14,C14) = .224526
p-value = KSDIST(G14,B14,C14) = .043055
Observations
The following expresses the relationship between the KSDIST and KDIST worksheet functions and the KSINV and KINV functions (see Kolmogorov Distribution for the definitions of KDIST and KINV).
KSDIST(x, n1, n2, TRUE, iter) = 1–KDIST(x*(λ+0.12+0.11/λ), iter)
KSDIST(x, n1, n2, FALSE, iter) = 1–KDIST(x*λ, iter)
KSINV(p, n1, n2, TRUE, iter0, iter) = KINV(p, iter0, iter) / (λ+.12+.11/λ)
KSINV(p, n1, n2, FALSE, iter0, iter) = KINV(p, iter0, iter) / λ
where λ = the square root of n1 ⋅ n2 / (n1 + n2).
Table Lookup Functions
Alternatively, we can use the Two-Sample Kolmogorov-Smirnov Table of critical values to find the critical values or the following functions that are based on this table:
KS2CRIT(n1, n2, α, tails, interp) = the critical value of the two-sample Kolmogorov-Smirnov test for a sample of size n1 and n2 for the given value of alpha (default .05) and tails = 1 (one tail) or 2 (two tails, default) based on the table of critical values. If interp = TRUE (default), then harmonic interpolation is used; otherwise, linear interpolation is used.
KS2PROB(x, n1, n2, tails, interp, txt) = an approximate p-value for the two sample KS test for the Dn1,n2 value equal to x for samples of size n1 and n2, and tails = 1 (one tail) or 2 (two tails, default) based on a linear interpolation (if interp = FALSE) or harmonic interpolation (if interp = TRUE, default) of the values in the table of critical values, using iter number of iterations (default = 40).
Note that the values for α in the table of critical values range from .01 to .2 (for tails = 2) and .005 to .1 (for tails = 1). When txt = FALSE (default), if the p-value is less than .01 (tails = 2) or .005 (tails = 1) then the p-value is given as 0, and if the p-value is greater than .2 (tails = 2) or .1 (tails = 1) then the p-value is given as 1. When txt = TRUE, then the output takes the form “< .01”, “< .005”, “> .2” or “> .1”.
For Example 1, we have the following:
D-crit = KS2CRIT(B14,C14, G1) = .229792
p-value = KS2PROB(G14,B14,C14) = .051232
Test Function
Finally, we can use the following array function to perform the test.
KS2TEST(R1, R2, lab, alpha, b, iter0, iter) is an array function that outputs a column vector with the values D-stat, p-value, D-crit, n1, n2 from the two-sample KS test for the samples in ranges R1 and R2, where alpha is the significance level (default = .05). b, iter0, and iter are as for KSINV.
If R2 is omitted (the default), then R1 is treated as a frequency table (e.g. range B4:C13 in Figure 1).
If lab = TRUE, then an extra column of labels is included in the output; thus, the output is a 5 × 2 range instead of a 1 × 5 range if lab = FALSE (default).
For Example 1, the formula =KS2TEST(B4:C13,,TRUE) inserted in range F21:G25 generates the output shown in Figure 2.
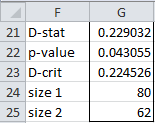
Figure 2 – Output from KS2TEST function
Example (raw data)
Example 2: Determine whether the samples for Italy and France in Figure 3 come from the same distribution.
Figure 3 – Two data samples
We first show how to perform the KS test manually, and then we will use the KS2TEST function.
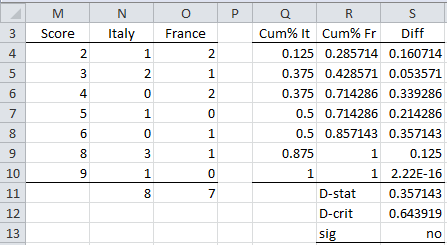
Figure 4 – Two-sample KS test
The approach is to create a frequency table (range M3:O11 of Figure 4) similar to that found in range A3:C14 of Figure 1, and then use the same approach as was used in Example 1. This is done by using the Real Statistics array formula =SortUnique(J4:K11) in range M4:M10 and then inserting the formula =COUNTIF(J$4:J$11,$M4) in cell N4 and highlighting the range N4:O10 followed by Ctrl-R and Ctrl-D. Finally, the formulas =SUM(N4:N10) and =SUM(O4:O10) are inserted in cells N11 and O11.
We can also calculate the p-value using the formula =KSDIST(S11,N11,O11). The result is p-value = .62169.
We see from Figure 4 (or from p-value > .05) that the null hypothesis is not rejected. Thus, we conclude there is no significant difference between the distributions of the two samples. The same result can be achieved using the array formula
=KS2TEST(J4:J11,K4:K10,TRUE)
which produces the output in Figure 5.
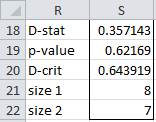
Figure 5 – Output from KS2TEST function
Finally, note that if we use the table lookup, then we get KS2CRIT(8,7,.05) = .714 and KS2PROB(.357143,8,7) = 1 (i.e. > .2).
Data Analysis Tool
Real Statistics’ Goodness of Fit data analysis tool also supports the Two-sample Kolmogorov-Smirnov Test. Click here for more information about this tool.
Examples Workbook
Click here to download the Excel workbook with the examples described on this webpage.
Links
References
MIT (2006) Kolmogorov-Smirnov test. Statistics for applications
https://ocw.mit.edu/courses/18-443-statistics-for-applications-fall-2006/pages/lecture-notes/
Wessel, P. (2014) Critical values for the two-sample Kolmogorov-Smirnov test (2-sided), University Hawaii at Manoa (SOEST)
https://www.webdepot.umontreal.ca/Usagers/angers/MonDepotPublic/STT3500H10/Critical_KS.pdf
May I know if how many respondent is allowed in using kolmogorov and shapiro wilk? please help me. thank you
This test will accept a large number of respondents. I am not sure what the top limit, but it is probably bigger than the number of respondents that you have.
Charles
Hi Charles,
I have 3 month sales data for 2019 (Jan, Feb, Mar) and similarly 3 month’s sales data for 2020 (Jan, Feb, Mar).
1) Can I use KS test to check if these have same distribution? Sample size will just be 3 here.
2) Can I use weekly data for sales to perform the test? Sample size would here increase to around 12.
3) What value shall I check: D crit and p value for my specific case?
Many thanks for informative post.
Regards,
Sumit
Sumit,
These scenarios seem to violate two of the assumptions for the KS test, namely:
1. The data from each sample are randomly drawn. This assumption is probably violated since there is likely to be autocorrelation from month to month or week to week.
2. The two samples are mutually independent. This may be violated since the data in 2019 and 2020 were probably from the same firm
Charles
Charles,
I hear you on the autocorrelation issue.
1. Can I use one-sample t-test or Wilcoxon test to compare if sales in entire year 2019 is different from Jan 2020?
2. Which test would you recommend for this?
Many thanks for your reply.
Regards,
Sumit
I suggest that you google “how to compare two time series”
Charles
Hi Charles,
I have a question about the this test which I tried my best and did not find the answer. I hope you can help me out.
I have two independent groups of data. I have ten subjects for each group. The reacton time data for each subject were measured 300 times for each session and repeated for 5 sessions. Next, I want to put all these measured reaction time data together and make a cumulative distribution for each group, then perform the K-S test to see if the two groups have similar distribution or not. For each group, I have 15000 raw data entries.
My question is whether I can use the K-S test for my data.
P.S. Do I receive an email after you post answer?
Thanks.
Hi Jack,
If each group has 10 subjects and each subject is measured in 5 sessions and each session has 300 measurements, does this mean that the sample size for each group is 10 x 5 x 300 = 15,000 or is it 10?
Charles
Hi Charles,
Thanks for your quick response. I wanto compare the 15000 individual data. The 10 subjects need to complete 15000 trials in total. The reaction time was collected for each trial.
Jack,
The problem with this approach is that the sample data elements are not independent since groups of 1,500 elements come from the same subject.
Charles
Hi Charles,
So even within the same group, the data must be independent? Then, do you have any suggestions to do it properly or is there other test I can use?
Thanks.
Hii Charles,
my m value is 64, n value is 83, and 0.05. D critic?
Kammy,
You can use the second formula on this webpage or the KSINV function also on this webpage to find the D-crit value that you are looking for.
Charles
Charles,
In example 1, when you used the function KS2TEST you used ranges R1 and R2 which represent the frequencies of the values in column A. In example 2, you used ranges R1 and R2 which represent raw values of scores and not their frequencies. I’m a bit confused which type of data should be entered as range in the function. For example, I have a large data set consisting of different percipitation rates (in mm) at different years, but every percipitation rate occurs only once, so the frequency of each event equals to 1, which means if I were to enter their frequencies as ranges in the function KS2TEST (as in example 1), it would be impossible to calculate Dstat (it equals 0), and if I enter raw values of percipitation rates (in mm) as ranges in the function, i do get some results, but I am rather doubtful whether this is true, because I don’t fully understand the nature of the data set which should be entered as a range in the function.
Thank you very much.
Charles
is there any constraint as to sample size with the two-sample K-S test?
I ask because I have several pairs of frequency distributions to compare, some of which have a sample size of 20,000.
I am a total moron with statistics and I acknowledge that mine is a purely statistical question rather than a technical (procedural) one, yet I would love to have your feedback.
Thanks in advance,
Carlo
Sorry, I guess I made a mistake in my previous comment.
When dealing with the K-S test and the relevant Real Statistics function, is sample size = number of entries (=10 in Fig. 1) or rather = number of individuals (=80,62 in Fig. 1)?
In my question above I meant that the number of individuals in my samples can be as large as 20,000.
Sorry again.
I see that the use of the ‘Frequency data’ routine gives the actual sample counts in the output (i.e., the number of individuals in my samples), whereas the use of the ‘Raw data’ routine gives the number of entries in the output. In each case the result of the test is totally different (p-vales of o and 0.98, respectively with my data).
What do you mean by Frequency data and Raw data?
In my case I have frequency distributions made of actual number of individuals in each size class: is this ‘frequency data’ or ‘raw data’?
My data:
Size_class Freq(n)_A Freq(n)_B
8 2 13
9 50 309
10 321 832
11 397 400
12 244 162
13 165 64
14 80 40
15 20 27
16 4 6
17 0 3
18 0 1
Hello Carlo,
This data appears to be in frequency table format.
The data in Figure 3 of this webpage is in raw data format. The equivalent frequency table format is shown in range M3:O10 of Figure 4.
Charles
See my response today to another comment from you on this issue.
Charles
The software should handle a sample size of 20,000. In fact it should handle a frequency table with 29,000 rows (which could result in a sample size of much more than 20,000).
The sample size of any of the procedures in the Real Statistics software usually falls into one of the following two categories:
1. No real limit, except what Excel itself imposes, although large samples may result in slow run times.
2. A limit of 64,000 rows
Charles
Two questions: Is there a reason I have to reload the pack each time I start Excel (2013) even though I’m using the newest update (I think – the one you mention elsewhere contains bug fixes)? And when I run KS2TEST, my only output is a cell containing D-stat, nothing else. What am I missing?
Thanks.
Hello Beth,
1. You shouldn’t have to reload Real Statistics each time you start Excel. If Real Statistics disappears from the Add-Ins ribbon, see
https://real-statistics.com/appendix/faqs/disappearing-addins-ribbon/
2. KS2TEST is what is called an array function and so you need to use it in a slightly different way to get all the output. See
https://real-statistics.com/excel-environment/array-formulas-functions/
3. The next release of the Real Statistics software will support the two-sample Anderson-Darling test. THis test is superior to the two-sample KS test. This release will be available in a few days.
Charles
Thank you! I think I got it to work. And I’ll look for the update with the Anderson-Darling test. I so appreciate this resource!
I just really want to say… Thank you! Real statistics and the Kolmogorov-Smirnof test package saved my diploma thesis.
Keep up the great work and once again thank you very much!
HI,
After much fighting with Excel 2019 and Win 10 I got the Real Statistics add-in to work. I know a little about statistics, enough to know what questions to ask. A mentor suggested the KS test to compare 2 sets of test grades, the intervention being some “innovations” in delivery. What I am trying to see is whether or not there is a statistically significant difference in test scores. The person who suggested the KS test restated my null and alternate hypotheses as:
Ho: The pre-and post-intervention scores come from the same distribution
Ha: The pre-and post-intervention scores come from different distributions
Using the KS2TEST function I got the following results:
D-stat 0.138906
p-value 0.807998
D-crit 0.294969
size 1 37
size 2 43
Can someone help me interpret the results? With such a high p-value and an alpha of .05 am I correct is thinking that there is no significant difference and that there is no proof based on these samples that the new methodology has made a difference in test scores?
Gerry,
Yes this is a correct interpretation.
Charles
Thank you sir.
Dear Charles
Thanks for the excellent website. This is really helpful.
Would like to ask one question:
The critical value for two sample test in KS test is = c(α) *sqrt ((m+n)/mn ), where “values of c(α) are the numerators of the last entries in the Kolmogorov-Smirnov Table.”
In the first example I tried to apply this. As per my calculation it is
1.35810*sqrt ((80+62)(80*62))= 0.229792
which is not matching with the value you provided (0.224317).
Is the difference is due to the fact that m & n are not sufficiently large? Or am I missing something?
Thanks & Regards
Kaustav
Kaustav,
All these values are approximations, and so they may be a little different.
Charles
Dear Charles
As a matter of curiosity, what do you think are large enough m and n?
Cheers
Mario,
For values of m <= 15 and n <= 20 you can find the critical values in the following table https://real-statistics.com/statistics-tables/two-sample-kolmogorov-smirnov-table/
For larger values you can use the given formula.
Charles
Hi,
I’m getting a different crit value for D(0.05,80,62) than you calculate here when I use the methods described in two other sources:
http://www.stats.ox.ac.uk/~massa/Lecture%2013.pdf
sparky.rice.edu/astr360/kstest.pdf
The value calculated as 1.36*Sqrt(1/80 + 1/62) = 0.2311358
The D-crit according to your calc is 0.224526.
This makes a difference in the outcome when comparing the D-stat of 0.22903.
The reason I’m comparing is because I’m unable to use your Real Statistics functions on my work computer due to security settings out of my control so I’m manually calculating and would like to know why there are these differences from different sources.
Thank you for your informative website and tools!
Colin,
Real Statistics offers two approximations to the critical value
The first, which is calculated using the table of critical values (or the KS2CRIT function), yields the value 1.3581*Sqrt(1/80 + 1/62). This is the same as the version you state, except that 1.3581 is a more accurate estimate than 1.36.
The other, which is calculated via the KSINV function, is an approximation that may be better for values of alpha that can’t be found in the table of critical values.
In any case, the difference between all these critical values is not very big. When alpha is .05, I would use the value calculated by KS2CRIT.
Charles
I see that now. I was wondering why in the first analysis using KSINV, D-stat > D-crit, rejecting the null, but in the second analysis using KS2CRIT, D-stat < D-crit which leads to a different outcome. This is the same question that Sam Salous brought up below and you answer that the results are borderline. I think I'm understanding the use of the test better. Thanks for your reply.
It seems to me that D(m, n, alpha) goes to zero when m and n go to infinity because the first depends only on alpha, which is fixed when alpha is fixed. The second is approximately sqrt(2/n) when n is nearly equal m. Thus, when m and n are sufficiently large, D(m, n) is likely larger than D(m, n, alpha).
I think my understanding is wrong somewhere.
Please explain me for what I have thought wrongly.
Trung Dung,
Yes, D(m, n, alpha) goes to zero when m and n go e to infinity. But then the question then is what does D(m, n) do as m and n get large. My intuition is that it doesn’t go to zero and so for large enough values of m and n, D(m, n) is likely to be larger than D(m, n, alpha). This is in agreement with your assertion. But this is not surprising. For all the usual tests, for large enough samples, the test always produces a significant result. You can think of it this way: if the sample is large enough, even a small difference will be big enough to be detected and show some difference in the population(s). This is why we need to be cautious not only about small samples, but also large samples. It is also why we tend to look at effect size, not only p values.
Charles
Hello,
I am attempting to perform the KS2TEST function, and when I highlight an area of 5 cells and type “=KS2” to start, the only functions that appear are KS2CRIT and KS2PROB. I have un-installed and re-installed the resource pack with the same result. Any tips?
Abby,
Try using the KS2TEST function anyway. I believe that I accidentally made K2TEST a hidden function, i.e. it works but I didn’t put it on the list of functions. Actually KS2CRIT and KS2PROB should not be on the list of functions (KSINV and KSDIST should be used instead).
I will correct this in the next release of the software, which should be available this month. In the meantime, use KS2TEST anyway.
Charles
Hi Charles,
I’m an engineer with very little background in statistics, and I am using the two-sample K-S test in MATLAB (“kstest2(…)”) to compare the distributions of error in an iterative optimization algorithm as a criterion to stop the program. Essentially, the closer and closer the algorithm approaches the correct solution, the distribution of the error should approach a steady state (i.e. comparing the current iteration’s error to the error of previous iterations should become closer and closer to the same distribution) and once the program is satisfied that the distributions of error from past iterations (a window of several are used) are the same, we stop the program. The problem (I think) is that I may not be using the p-value returned by the K-S test appropriately. I leave the significance level at the default 5%, but I continually monitor the p-value returned by the K-S test between pairs of samples to reach a certain threshold value (which I have as a variable). I notice that the p-value gets bigger (closer to 1) the closer the sample distributions become – is that true? For instance, if I compare two distributions with the K-S test (at significance level of 0.05) and it returns a p-value of 0.70 (well above the level that would be needed to conclude they were *not* from the same distribution), but then for the next iteration the K-S test returns 0.90, does this mean that the latter two distributions are more likely to be from the same distribution than the former (i.e. they are a better fit to each other)? It boils down to this question: even though the K-S test’s strength lies in *rejecting* the null hypothesis that two samples are from the same distribution, can I use the magnitude of the p-value as an indicator for how well two samples fit into the *same* distribution?
I’d appreciate any thoughts you have as this is *not* my area of expertise at all.
Thanks,
– Cam
Cam.
If the p-value is high, this means that you can’t reject the null hypothesis that the two sample comes from populations with the same distribution.
If the p-value keeps getting higher, then it probably means that the algorithm hasn’t converged yet or that the algorithm is not appropriate for your data or that you made some mistake. I am not familiar with how MATLAB performs this test and so I can’t comment further about the situation. The Real Statistics resource performs the two sample KS test in Excel, and so I have better insights into the results from this software.
Charles
Hi, can you point me to the reference of the formula of the critical value? It seems that every website (including Wiki) is talking about the formula, but no one has a real reference.
Chen,
If I understand your question correctly, you can find the formula in many references, including the following:
http://sparky.rice.edu/astr360/kstest.pdf
Charles
I have a short question: What would be the correct interpretation when I have D = 0.011579 and p100.000). I’m not sure if even with this marginal difference in D statistic it’s correct to reject the null hypothesis.
Thanks in advance
Chris,
Sorry, but I don’t know what p100.000) means.
Charles
Yup, me neither. Something went wrong with my keyboard. My question was: What would be the correct interpretation if I have a D = 0,01 and p = 2,2E-12? Because if I just consider the D value I’d say both distributions are equal. On the other hand, if I take into consideration just the p-value I’d say both are different. Both samples are greater than 100.000 records.
Hi Charles, I’d really appreciate if you can provide any insight. Thanks!
Chris,
I don’t have any further insight based on the information available to me.
If you send me an Excel file with your calculations, I will try to figure out what is happening.
Charles
My previous post was incorrect. KSINV(p,n1,n2) gives wrong results for the example of n1 and n2 both = 50 and p outside the interval 0.2 to 0.46. If for a given D, p=KSDIST(D,n1,n2) is calculated for n1 = n2 = 50, then KSINV(p,n1,n2) only returns the original D-values for 0.2 ≤ D ≤ 0.46. Outside this range it produces a constant value for D 0.46.
The same behaviour pertains for n1 and n2 not equal to 50.
Has this been addressed in later versions of KSINV for the Mac? (Mine was uploaded to your website in Jan 2014). If not, is there an algorithm that allows for calculation of the limiting values of p in KSINV for given n1 and n2?
Blyth,
I will look into the accuracy of the KSINV function shortly.
The latest MAC release is Rel 3.4.3, which was issued on 3 February 2015.
I don’t believe that I have made any further changes to the KSINV function since then.
Charles
Blyth,
The next release of the Real Statistics software will correct this problem. KSINV and KINV should work properly for values of p between .00001986 and .27. This release should be available this week.
As mentioned elsewhere, I am also working on a new Mac release. This will likely take a little longer since certain Excel support that I use is not available for the Mac and so I needed to create these capabilities myself.
Charles
Many thanks. I will look forward to the new release for Mac
In the version of RealStats-2011 that I was able to download for the Mac, there are limitations on KSINV that are not apparent or are not described in the table giving all the Excel functions that are available in REALSTATS-2011.
For n1 and n2 = 50, KSINV only gives correct answers for 0.2 ≤ p ≤ 0.46 (or thereabouts). For p outside these limits KSINV gives fixed results independent of p. For n1 and n2 different from 50 the range of p also limited (but different).
Is there a table or some algorithm that would allow these limits to be estimated for given n1 and n2?
My version was uploaded to your website in January 2014. Perhaps there is a later version that I can download.
Hi, I have a questions regarding the sample size. Let’s said I have n=4 for male sample and n=4 for female sample for different age group. How would you calculate the D value and critical value? Would you sum up all 4 sample or get the average, then only compare between two distribution?
Minzi,
It depends on what you are comparing. If you want to compare females with males for a specific age group, then you follow the instructions described on the referenced webpage. If you want to do something else, then this would depend on the specific comparison you want to make. Don’t expect much, however, if you sample size is so small as n = 4.
Charles
Hi Charles,
Thanks for the reply, I think I may describe it wrongly in my previous question, in each sample I have about 1000 and above raw data for the control and treatment group and I want to compare their specific position. I can easily perform the KS test as described above. However, I repeated the similar experiment for 4 times, and I am having difficulties whether I should sum up all the data or should I take the average for four times for each specific position to run the test.
Thank you.
Minzi,
I expect that you will get the same answer whether you use the sum or average.
Charles
Hi Charles,
If I calculate c(alpha) as KINV(alpha), I get slightly different c(alpha) results than using this formula SQRT(-1/2*LN(alpha/2)) which is recommended in Wikipedia.
Why does the difference occur?
Is it because of iterations? If yes, then why are the iterations necessary here and what is the iterations’ meaning here (in practical way)?
On what does it depend the chosen number of iterations?
Appreciate your answers!
In this formula KS2TEST(R1, R2, lab, alpha, b, iter m), when R1 and R2 sample sizes are different:
1. Does m is equal to bigger sample size or exactly to second (R2) sample size?
2. is the comma missing between ‘iter’ and ‘m’ in this formula?
Thanks!
Ruta,
Yes, the comma is missing from the formula. I have just corrected this webpage. Thanks for identifying this typo.
KS2TEST can be used even when the sample sizes are different. The sample sizes are calculated from R1 and R2.
m = the # of iterations used in calculating an infinite sum (default = 10).
Charles
Ruta,
If you are referring to the KDIST(x, m) function, then the number of iterations m refers to how many of the terms in an infinite sum are used. Generally m = 10 is sufficient, but you could try m = 20 to see whether you get a different result (the bigger the m the more accurate the result, although at a certain point the won’t be any further improvement).
Charles
Ruta,
Both are approximations. For alpha = .05, the Wikipedia value is 1.358102. The KINV value is 1.358099. I don’t know which is more accurate, but usually it won’t make much of a difference.
Charles
Many thanks for Charles for this explanation and comments sent in by others. These really helped me with my cumulative data comparison.
Nishi,
Glad we could help.
Charles
I now understand how to manually calculate the D-crit value by reading your explanations in the comments. However, I think the equation is slightly wrong:
D-crit = c(alpha)*root((m+n)/(m*n))
when m and n in the explanation are the sizes of the arrays, not the sums.
Because of this, I was originally calculating
D-crit = 1.36*root(20/100)
and didn’t realize you meant the sums until reading the comments.
Thanks!
Clisby,
I am not sure what you mean by the “sums”. In any case the webpage states “Suppose that the first sample has size m … and that the second sample has size n …” Is this incorrect?
Charles
how to get critical value from the K-S table
Amir,
The values of c(α) are the numerators of the last entries in the Kolmogorov-Smirnov Table. The other entries in the table are not used for the two sample test.
Charles
I tried to use the values of c(α) are the numerators of the last entries in the Kolmogorov-Smirnov Table to replicate example 1 above but got:
D critical = 1.36 * SQRT((80+62)/(80*62)) = 0.2301 instead of your calculated value of 0.224317 and that gives the opposite conclusion.
Any help in understanding how to calculate D critical is appreciated.
Thanks
Sam,
These are two ways to calculate the same thing. The values are not that different. If one answer yields a significant result and the other doesn’t, then the reality is probably borderline and should be reported that way. If the p-value is .0501 then commonly you accept the null hypothesis, while if the p-value is .0499 you reject it. The reality is that the result is pretty much the same, namely an approximately 1 in 20 chance of a type I error.
Charles
how to find the critical value manually through k-s table test
This is described on the referenced webpage.
Charles
I have sets of Histogram data which I wish to use the KS2TEST on.
If I have use {=KS2TEST(KS2TEST(A3:A19,C3:C19,TRUE)} I get,
D-stat 0.352941176
p-value 0.190007633
D-crit 0.441915967
size 1 17
size 2 17
But If i put the two columns of data next to each other and use {=KS2TEST(A3:B19,,TRUE)} , I get
D-stat 0.800345968
p-value 0.005280863
D-crit 0.096198483
size 1 197
size 2 29999
In the first example, the sizes represent the number of bins of the histogram data but not the cumulative number of points. Which Should I be using?
Thanks for the great site.
Sorry, I pasted into the comment wrong. The first function in excel is correctly (I think) {=KS2TEST(A3:A19,C3:C19,TRUE)}
Hi Charles,
I downloaded the most recent Real Statistics Resource Pack, but the “KS2TEST” function doesn’t seem to show up on Excel. I have previously used it on Excel. Is there anything different about the most recent Resource Pack? I have the 2010 32-bit version of Excel.
Thanks,
Mark
Mark,
Nothing has changed. You should see the KS2TEST function on the latest version of the Resource Pack. In any case, you can access the same capability from the Non-parametric Test data analysis tool.
Charles
I have a similar problem. The check box is ticked for the real stats pack however it will not work until I reload it from the add-ins menu.
David,
Does it still work when you press Ctrl-m?
Is Solver checked?
Please look at the recent blog about the Disappearing Addins Ribbon at Blogs
Charles
Thanks. The blog post covered it. Version 2013 problems.
Hi
I would like to test which distribution fits my data better, weibull or pareto. could you please help me how I can use Real Statistics pack to do this test.
Thanks
Shkey
Sorry Shkey, but the Real Statistics Resource Pack doesn’t currently do this. You can, however, use the approach described on the following webpage to see whether either of these distributions is a good fit.
Goodness of Fit
See especially Example 4.
Charles
Hi Charles,
Thank you for your reply. Perfect, I’ll follow example 4 but I need your help. e.g. I have 70 datapoint and would like to check lognormal distribution. I’ll find the parameters, mu and sigma. To find out the expected value, should I use :
E=LOGNORM.DIST(x,mu,sigma,TRUE)?
then compute column F as suggested in Example 4.
the df is 70-2-1=67?
and then do the rest!
Thanks in advance,
Shkey
Hello Charles,
Thank you for the excellent post and the resource pack. They are both very useful.
I have a question regarding the KS test. Do you know how to perform a KS test on weighted samples? Calculating cumulative distributions is straightforward, but I am not sure how to calculate the critical value. Does the same formula apply? If yes, should n and m be the unweighted sample sizes?
Best regards,
Damir
Hello Damir,
I am sorry, but I don’t yet support a weighted version of the KS test. I will add this to the list of future enhancements.
Charles
Hi Charles,
Should the Kolmogorv-Smirnov test work now for non-integer values? It doesn’t work for decimal values, but I’m wondering if I’m using an older version.
Thanks,
Mark
Mark,
In the latest version, the values can be decimal numbers. E.g. in Example 2 if you change cell J10 to 6.1 the output does not change, but if you now also change cell K10 to 6.1 the output changes.
Charles
Dear Sir
I hope you are well and have a very happy time .I am working in fisheries
research center of Guilan province in North of Iran .I have a project on
population dynamics of invader Freshwater shrimp Macrobrachium nipponens in
Anzali wetland . I want to know the proceedure for How to test similarity
among the length frequency distribution between sexes by Kolmogorov-Smirnov
test whit SPSS
I wonder if you kindly furnish me by guiding me the procedure for how to
test this length frequency by this test . As you know due to misbehavior of
our government ,Iran is under sanction of UN and we hope one day Iran can
have a good relation with free world .I trust that you will give me your
kind consideration to my request .I never forget your help.I never forget
your help
My postal address is :
International Sturgeon Research Institute , P.O.Box 41635-3464 ,Rasht ,IRAN
Thank you in advance and I am looking forward to hearing from you .I am
sorry to put you in trouble.
Yours very sincerely ,
Shahram Abdolmalaki
Shahram,
Sorry, but I don’t use SPSS and so don’t know the procedure for performing the Kolmogorov-Smirnov test in SPSS. The following webpage shows how to perform this test in Excel:
Two Sample Kolmogorov-Smirnov Test
Charles
Hi Charles,
I have a problem here ..
I have two samples and I did the test. I found D-stat > D-crit, and I reject the null hypothesis. But when I look at p-value, I found a big value (72%) indicating to not reject the null hypothesis. When I use the KS2TEST function, I found the same results. How can I conclude my test? Reject or not reject ?
Thanks a lot
James,
If you send me an Excel file with your data and test results I will try to figure out what is happening. You can find my email address at Contact Us.
Charles
Thank you Charles,
I’ve learned a lot from your nice website and also from your kind help before. Thank you. I have a question though. Now I have a scatter plot (it seems plots are not allowed to put in this comment) of two continuous variables (x, y) for two separate groups (a and b). Group a, for instance, includes points x1(1,2), x2(2,3), x3(1.5,2), etc. Group b includes y1(2,5), y2(3,4), etc. Two groups have the same number of variables. I am wondering whether these two groups are significantly different from each other.
I looked up in the Internet and some say that a two-sample Kolmogorov–Smirnov test could be done. Is this OK? If not, what kind of measure is preferable?
Thank you!
Best,
Stacey
Stacey,
Yes, this test can be used. If you only want to test whether the means/medians of the two groups are significantly different then there are other choices (t test, Mann-Whitney). None of these tests require that the two groups have the same number of elements.
Charles
Thank you Charles.
Sorry I did not make my question clear. Each element in two groups has two variables. Part of them are displayed below:
Group a Group b
a1(1.48, 2.99) b1 (2.37, 12.8609)
a2(1.68, 4.98) b2 (1.48, 3.5667)
a3(2.27, 11.27) b3(1.76, 6.3466)
a4(1.71, 4.78) b4(1.98, 9.6587)
a5(1.97, 7.95) b5(1.27, 1.1167)
Thus now we have four sets of data (each group has two sets of variables). Two groups can be drawn as two scatter plots. So I want to know whether these two distributions are different or similar to each other. Because I saw that two-sample KS was used for two samples. I don’t know whether it will work for my current situation. Thank you.
Stacey,
I don’t know away of doing this. The only thing I can think of is to create a transformation f of (x,y) into z such that f(x,y) = f(u,v) if and only if x = u and y = v. In this case you can use the two-sample KS on the mapped values.
The specific transformation f probably depends on the nature of your data.
Charles
Charles,
I think I understood your meaning. I’ll find a proper transformation f for my data. Thank you very much. 🙂
Stacey
The first thing popping into my head is euclidean distances of these coordinates. I’ll try it.
Are the correct Ns really 80 and 62 for the first sample? or N=10 for each gender?
I tried the same data in a different program and got a different P value and I think it is due to the differences in N.
Zachary,
80 and 62 for the two samples.
Charles
Hi Charles,
I would like to know, from where you got the formula you are using in your KSINV function to calculate the critical value. I couldn’t find anything about this calculation.
Why are you thinking this is more accurate?
Kind regards,
Nicole
Hi Nicole,
The KSINV function is based on the Kolmogorov distribution, which is described on the webpage
Kolmogorov Distribution
There is no reason to think that the values from the KSINV function are more accurate for values that are found in the KS Table. For values not in the table the values from KSINV may be more accurate than an interpolation from the KS Table.
Charles
Hi Charles
Thank you for your explanation! I have a question though. I do understand your procedure, but when I copied the cum% values from Fig1 to my stats software (GraphPad Prism) and run a ks test there I get the following results:
Kolmogorov-Smirnov test
P value 0,7591
Exact or approximate P value? Approximate
P value summary ns
Significantly different? (P < 0.05) No
Kolmogorov-Smirnov D 0,3000
The same happens when I put those values on the online ks test software:
http://www.physics.csbsju.edu/stats/KS-test.n.plot_form.html
Here the result is "The maximum difference between the cumulative distributions, D, is: 0.3000 with a corresponding P of: 0.675"
So in neither of those cases the result happens to be significant. Why is there such a difference?
Thank you for your help!
Andy
PS: The numbers I entered into the programs were:
Items in Data Set 1:
5.000E-02 0.188 0.250 0.338 0.338 0.400 0.512 0.675 0.925 1.00
Items in Data Set 2:
0.113 0.177 0.194 0.371 0.565 0.629 0.661 0.726 0.855 1.00
I just found the answer to my own question. What I need to use is the “raw” data, not the frequencies. The online test gives the right values (D, is: 0.2290 with a corresponding P of: 0.043), but GraphPad Prism gives me a different P:
P value 0,0512
Exact or approximate P value? Approximate
P value summary ns
Significantly different? (P < 0.05) No
Kolmogorov-Smirnov D 0,2290
I suppose this example shows this can be problematic, as Prism would have considered these two distributions are similar.
Andy,
When you enter the specified data into GraphPad or the online tool, these software programs expect that you are entering raw data values for the two samples and not cumulative distribution values. In fact, if I enter the same data in the range A1:B10, then the Real Statistics array formula =KS2TEST(A1:A10,B1:B10,TRUE) will output results similar to that given by the online KS tool, as shown below.
0.05 0.113
0.188 0.177
0.25 0.194
0.338 0.371
0.338 0.565
0.4 0.629
0.512 0.661
0.675 0.726
0.925 0.855
1 1
Output from =KS2TEST(A1:A10,B1:B10,TRUE)
D-stat 0.3
p-value 0.675078154
D-crit 0.564636591
size 1 10
size 2 10
If you want to use GraphPad or the online tool to get the result for the original data, you must enter the following input data into these tools (unless they provide an option for frequency data input like the Real Statistics software does):
21 21
21 21
21 21
21 21
23 21
23 21
23 21
23 23
23 23
23 23
23 23
23 25
23 27
23 27
23 27
25 27
25 27
25 27
25 27
25 27
27 27
27 27
27 27
27 29
27 29
27 29
27 29
31 29
31 29
31 29
31 29
31 29
33 29
33 29
33 29
33 31
33 31
33 31
33 31
33 33
33 33
35 35
35 35
35 35
35 35
35 37
35 37
35 37
35 37
35 37
35 37
35 37
35 37
35 39
37 39
37 39
37 39
37 39
37 39
37 39
37 39
37 39
37
37
37
37
37
37
37
37
37
37
37
37
39
39
39
39
39
39
Charles
hello sir
i try to use two-sample kolmogorov-s test for negative data , but i can not, can you explainfor me what do i do?
I have used this test with negative data without any problems. What you can’t make negative are the frequency values.
I you send me an Excel file with your data, I can try to figure out where the problem is. See Contact Us for the email address.
Charles
Hello,
Thank you for such a nice information.
the question is that, the maximum difference between cumulative frequencies between two data-sets maybe less than zero (negative) is. and if we deny the negative sign of this value, it would be more maximum than positive deference.
To clear the question, I would give you an example:
after calculate the difference between cumulative of two data-sets, the maximum and minimum values are 0.00086 (maximum positive) and -0.009196 (maximum negative) with alpha=0.05.
Could you please give us information in this case?
Thank you in advanced
The test uses the maximum of the absolute values of the differences, and so in your example 0.009196 would be used (note that I need to use the absolute value of the maximum negative in this case).
Charles
Hi Charles
I have tried to calculate the critic d from example 1, but I get a different result.
Can you please write on the exact calculation that you did ?
I did : 1.36* sqrt{(62+80)/(62*80)}= 0.230114
and you get 0.224317
Regards, Elizabeth
Elizabeth,
Your estimate is close enough. The value I used is a refinement which is supposed to be a bit more accurate.
Let a = 1.36 and b = sqrt{(62+80)/(62*80)}.
Instead of a I used A = KINV(.05) = 1.358099…
Instead of b I used B = 1/(.11*b+1/b+.12)
The value A*B = 0.224317.
Charles
Hello! I have a problem using KS2TEST function – I have decimal values, and I get #VALUE instead of the answer. You said in the previous comments above that you revised the formula and that there is a new version that works with decimals. Where can I get it. If there isn’t one, how else can I solve the problem?
Alexandra,
I just tried an example with decimal numbers and it works fine.
If you send me an Excel spreadsheet with your data I will try to figure out what has gone wrong.
Charles
Thank you for an insightful post!
Out of curiosity. Consider you have three independent samples instead of two, and you wish to investigate whether they come from the same distribution. Is there a K-S test for more than two samples?
Thank you,
Christoffer
Christoffer,
I am not familiar with a multi-sample KS test, but I found the following references for such a test:
http://epub.wu.ac.at/2960/1/Report105.pdf
http://projecteuclid.org/DPubS?service=UI&version=1.0&verb=Display&handle=euclid.aoms/1177706261
Charles
Hello,
I’ve reproduce the calculation of two sample K-S test with another sample. I get acceptance of H0 when I reduce alpha. I would have exected the opposite. Am I wrong or is there something wrong with my calculations?
Thanks!
ps: I’m trying to use this test to check if two rainfall gauges are in the same homogeneous region. (the sample is total rainfall yr-1 for stations 1 and 2, total rainfall yr-2 for stations 1 and 2, etc.) . Is this a good choice of test? Is there a better suited test for my task?
Mathieu,
The null hypothesis for this test is that both samples come from a population with the same distribution. The smaller the value of alpha the less likely to reject the null hypothesis (i.e. the critical region is smaller), and so it makes sense that you would reject the null hypothesis at some value of alpha and not reject it at a smaller value. E.g. in a two-tailed test if alpha = .5 then you would always reject the null hypothesis and with alpha = 0 you would never reject the null hypothesis. Also, since hypothesis testing is probabilistic in nature, researcher avoid the phrase “accept the null hypothesis” and use phrases such as “can’t reject the null hypothesis”.
From the information you have provided, I can’t tell for sure whether two sample KS test is the right test to use. In particular, I don’t know what “the same homogeneous region” means, but if it means that the two regions might as well be considered to be parts of one larger region with the same characteristics, then it seems that the KS test is an appropriate test.
Charles
Thanks for this most appreciated reply. I had a look at the alpha-C(alpha) table and understood I was wrong in the interpretation of alpha.
However, I’m still struggling to understand what does alpha represent. Let say I can’t reject the null hypothesis for alpha = 0.001. Can I associate this with a certain level of condidence? Or I can only say that the results of the KS test is “weak”, or…?
Many thanks.
Mathieu,
I suggest that you read the following two webpages:
Null Hypothesis
Confidence Interval
Charles
Hi,
Does the two-sample Kolmogorov-Smirnov test require the class intervals to be equal across the whole range of the data? I have some very strongly skewed data where using equal classes loses much detail for low values, and gives many classes with zero observations for higher values. Will the K-s test still be valid if I use more classes at lower values and fewer at high values?
Thank you
Kate,
If I remember correctly, the two samples must be random samples and so there is no equal interval requirement. See, for example, Example 2 on the referenced webpage.
Charles
Hi,
is a two-tailed test?
Thank you for your website!
Best regards
Maria
Maria,
This is a two-tailed test. A one-tailed test can also be defined (i.e. F(x) >= G(x)), but that is not what I have done on the referenced webpage.
Charles
Charles:
In Real Statistics 3.5 a problem is still present for decimal values when using Kolmogorov-Smirnov test:
1. With Kolmogorov-Smirnov (raw) option in “Additional Non-parametric Tests” in Data Analysis Tool; and
2. With the function =KS2TEST
As Donato, I get “#VALUE!” in both cases when decimal values are used in the columns to be compared.
I send my data with the purpose of you can analyze it:
Pretest(R1, D5:D18) Posttest(R2, E5:E18)
0.997673113 0.264002119
0.577424025 0.860549053
0.000204027 0.923131895
0.912676161 0.996300517
0.923920025 0.001646899
0.153323325 0.024959612
0.309162014 0.964058172
0.998794874 0.945081912
0.999989659 0.997708808
0.963914334 0.087593341
0.047632851 0.998809053
0.932418329 0.954355755
0.999954638 0.38811265
0.999686141 0.990518966
KS function was written as follows:
=KS2TEST(D5:D18,E5:E18,TRUE,I6)
Data Analysis Tool used the same formula. Results were the following (equal in both cases):
Two Sample Kolmogorov-Smirnov Test
Alpha 0.05
#VALUE! #VALUE!
#VALUE! #VALUE!
#VALUE! #VALUE!
#VALUE! #VALUE!
#VALUE! #VALUE!
Thank you.
William Agurto.
William,
I corrected this bug and tested the correction, but for some reason the correction was not included in the final version of the Rel 3.5 software. I have just issued a new release, Rel 3.5.1, which I hope now reinstitutes the correction. Sorry for the inconvenience and thanks for bringing this problem to my attention.
Charles
Charles:
Real Statistics 3.5.1 now is OK for Kolmogorov-Smirnov test. There’s only a little bug: when using the Real Statistics Data Analysis Tool without changing the default value of alfa (.05), results are incorrect, because that tool uses KS2TEST formula with alfa=5 instead of alfa=0.05. But the results are correct if the user types the correct value of alfa in the interface window of “Additional Non-parametric Tests” (0.05). I supposed the mistake origin is this: in the window, alfa= 0,05 (with comma). I supposed it has to be 0.05 (with a dot).
Thank you.
William Agurto.
William,
There are two ways that I know of for changing the decimal delimiter: from the Control Panel or from Excel Options > Advanced. When I Use the Control Panel to make the change the value of alpha performs as expected. When I change the decimal delimiter using both Excel and the Control Panel everything works properly as well. When I only use Excel to change the delimiter the dialog box displays the default value of alpha as 0.05, but output from the data analysis tool is correct (and alpha is displayed as 0,05). In this latter case if instead I try to change the value of alpha in the dialog box (even from 0.05 to 0,05) then the output will display alpha as 5 (as you have said). You can of course change the value of alpha in the output to 0,05 and then the KS2TEST formula will give the correct answer. I will need to look into how to get this latter case to work correctly.
Charles
change the value of alpha from Excel
Sir,
I’ using KS2TEST with the two samples below in column L and M, rows 2 to 14:
L M
2 -0.4470 0.1320
3 -0.2720 -0.3060
4 0.5120 -1.3670
5 -0.2640 -0.6470
6 0.2280 -0.1230
7 1.0490 0.5440
8 0.0980 0.6760
9 -0.0420 1.8000
10 0.0960 0.7110
11 -0.5390 0.6600
12 -0.3810 0.0910
13 0.2620 0.7270
14 0.1680 0.5640
If I use: {=KS2TEST(L2:M14,,FALSE)} it works and I get the values below:
1.1005
0.074847002
1.166116577
1
6
If I use: {=KS2TEST(L2:L14,M2:M14,FALSE)} it does not work and I get this:
#VALUE!
#VALUE!
#VALUE!
#VALUE!
#VALUE!
Donato,
You are correct that the {=KS2TEST(L2:L14,M2:M14,FALSE)} does not work. The formula works for integer data but not decimal values. I have now fixed the problem and the revised version of the function will be available in the next release of the software, which will be issued this week.
The correct values of the formula are:
D-stat 0.461538462
p-value 0.086993934
D-crit 0.500652861
size 1 13
size 2 13
The formula {=KS2TEST(L2:M14,,FALSE)} uses data in frequency format, which is different from what you wrote in your comment. With your data, the input should be in the following format:
K L M
1.8 0 1
1.049 1 0
0.727 0 1
0.711 0 1
0.676 0 1
0.66 0 1
0.564 0 1
0.544 0 1
0.512 1 0
0.262 1 0
0.228 1 0
0.168 1 0
0.132 0 1
0.098 1 0
0.096 1 0
0.091 0 1
-0.042 1 0
-0.123 0 1
-0.264 1 0
-0.272 1 0
-0.306 0 1
-0.381 1 0
-0.447 1 0
-0.539 1 0
-0.647 0 1
-1.367 0 1
Note that the first column (column K) is not used in the formula, but is listed so that you can see the order of the data elements. Obviously this format is more useful with data that has lots of repetitions.
The output is the same as listed above.
Charles
Charles:
I downloaded Real Statistics 3.4 and I used the Data Analysis Tool option “Other non parametric tests”. But the window that appeared allowed entering only one input array. I supposed then I had to enter the data as a unique frequency table, but the answer was different from what I got when used the function “KS2TEST” (when KS2TEST was used with two arrays instead of one frequency table; the results are the same when I used KS2TEST with the frequency table).
My data sets are:
Pretest (R1, G11:G30) Posttest (R2, H11:H30)
72 95
30 69
38 61
52 32
62 8
29 46
17 83
98 23
59 16
79 74
22 2
76 16
22 53
36 29
69 45
27 5
46 67
59 76
55 92
63 48
I formed the following frequency table (using the “frequency” Excel function):
Interval Pretest (M11:M20) Posttest (N11:N20)
0-10 0 3
10-20 1 2
20-30 5 2
30-40 2 1
40-50 1 3
50-60 4 1
60-70 3 3
70-80 3 2
80-90 0 1
90-100 1 2
Real Statistics Data Analysis Tool provided the following results (using as array input the frequency table, both columns in R1 array, omitting R2 array, as in your example 1):
D-stat 0.2
p-value 0.770952945
D-crit 0.409428086
size 1 20
size 2 20
That answer is different from the results obtained when using Real Statistics Function KS2TEST with the two arrays (R1 and R2):
=KS2TEST(G11:G30,H11:H30,TRUE,0.05)
D-stat 0.25
p-value 0.497342335
D-crit 0.409428086
size 1 20
size 2 20
But the answer is the same when using the frequency table:
=KS2TEST(M11:N20,,TRUE,0.05)
D-stat 0.2
p-value 0.770952945
D-crit 0.409428086
size 1 20
size 2 20
Does it occurs because using the originals arrays R1 (Pre-test) and R2 (Post test) is more accurate than using frequency tables? If so, why doesn’t Real Statistics Analysis Tool allow to choose the two input arrays rather than only the frequency table?
Are similar differences with other nonparametric tests in Real Statistics 3.4 Data Analysis Tool?
Thank you very much.
William Agurto.
William,
Thanks, as usual, for your very insightful and instructive comment. First of all, when data is organized in a typical frequency table then usually some accuracy is lost. However, if the frequency table doesn’t contain intervals but single values instead then no accuracy is lost. For the example that you have given such a “frequency table” takes the following form:
Val freq-Pre freq-Post
2 0 1
5 0 1
8 0 1
16 0 2
17 1 0
22 2 0
23 0 1
27 1 0
29 1 1
30 1 0
32 0 1
36 1 0
38 1 0
45 0 1
46 1 1
48 0 1
52 1 0
53 0 1
55 1 0
59 2 0
61 0 1
62 1 0
63 1 0
67 0 1
69 1 1
72 1 0
74 0 1
76 1 1
79 1 0
83 0 1
92 0 1
95 0 1
98 1 0
This table was created as described in Example 2 of the referenced webpage. If you use the Other Non parametric Tests data analysis tool choosing the second and third columns of the above as your input you will get the same answer as =KS2TEST(G11:G30,H11:H30,TRUE,0.05)
By the way, I give an example of how to use the Other Non parametric Tests data analysis tool for the two sample KS test on the webpage
https://real-statistics.com/non-parametric-tests/data-analysis-tools-non-parametric-tests/
As you have mentioned the data analysis tool only supports the frequency table format and not the raw data format. This was done only out of expediency so as not to delay the release. I will add the raw data format shortly.
Charles
Charles
Hi,
Is there a way to do a large number of Kolmogorov-Smirnov tests at once? I have data separated in columns by a space, but because the output is an array, I can’t simply copy the function along the bottom row, the way I could for your Mann-Whitney function. Thanks!
Mark,
If you space the columns evenly you should be able to do what you want. You can copy array functions just like you do non-array function by using Ctrl-C and Ctrl-V. You just need to be sure that you copy the entire array. You don’t need to highlight the entire range that you are copying into: you just need to highlight the upper left cell of that range.
Any reformatting needs to be done after the copying. You can then remove unwanted blank columns. While you can’t delete any cells in a range that contains an array formula, if you don’t need all the cells in the range, then after you finish the copying, you can use formulas such as =D4 to reference just the cells you want. Alternatively you can copy and then paste “values”.
If none of this works for you, send me a spreadsheet describing what you want to accomplish and I will see whether I can figure out how to do it.
Charles
Hi Charles,
Thank you – it worked! I appreciate the detailed response. You rock.
Best,
Mark
Hi, nice tutorial, very informative. I had a doubt. Can we use it for matching shapes?
thanks
It depends on what you mean by the same shape. The two sample KS test determines whether two samples have the same distribution. If the goal is to determine whether the samples come from the same distribution with some change in parameters (e.g both are normal but with different means and/or variances), then the answer is no.
Charles
I am trying to use the KS2 function (after downloading/installing tyhe real statistics resource pack) using for example ks2test(c30:p30,c34:p34,TRUE) and I get an error. the c30:p30 is one sample and c34:p34 the other sample of data.
Lets say I recreate your data from Figure 2. I then do the KS2test function and select the first column and second column like you do in your example. the output then just lists “D-stat” in the selected cell and no numbers or other output. Am I missing a step?
Adam,
The K2TEST function is an array function. You therefore need to highlight a 5 x 2 range and press Ctrl-Shift-Enter. This is explained on the referenced webpage.
Charles
thank you, that works. Is this function only supposed to work with numbers >1?
Adam,
The functions should work with any values >= 0. These values represent frequences and so should be non-negative.
Charles
Adam,
If the error is the one you referenced in your subsequent comment, then I have addressed this in my response to that comment. If you are getting an error message, then I suggest that you send me the worksheet where this occurs, since the formula should work provided the data is appropriate.
Charles
Hi.. i dont get same value for the critical value in your example above using the manual formula. Sample Size (m) 80 and sample size2 (n) is 62. Using the formula Dmna = 1.36 Sqrt of (m+n)/(mn), I’ve got the critical value equivalent to 0.23011 while in your sample 0.22437. This could lead to another conclusion to accept the null hypothesis instead. Kindly show me the correct computation. I will be reporting this in our class. Thank you.
Alie,
Dmna = 1.36 Sqrt of (m+n)/(mn) is the commonly used estimate of the critical value, although I believe that the estimate using the KSINV function gives a more accurate answer. Thus I would use the .22437 figure.
Charles
hello sir
i try to use two-sample kolmogorov-s test for two distributions , but i can not find KSDIST and KSINV in excel, how can i find them?
Hello Fatemeh,
KSDIST and KSINV are not standard Excel functions, and so you won’t find them in Excel. They are available from the Real Statistics Resource Pack, which you can download for free at https://real-statistics.com/free-download/real-statistics-resource-pack/. Once you install the Real Statistics Resource Pack you can use these functions like you would use any other function in Excel.
Charles