Basic Concepts
For n sufficiently large, the values of Dn,α (two-tailed) (see Kolmogorov-Smirnov Test) are approximately equal to the inverse of the Kolmogorov distribution divided by the square root of n. This holds even for values of α not found in the Kolmogorov-Smirnov Table. The cdf of the Kolmogorov distribution has the value
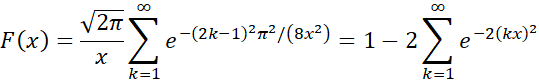
For sufficiently large n, 
Furthermore, for any value of n, the critical value Dn,α is approximately equal to
![]()
where Dα is the critical value of the Kolmogorov distribution. E.g. for α = .05, (i.e. F(1.3581) = .95 where F(x) is the cdf of the Kolmogorov distribution, as described above. Thus, for example
![]()
Worksheet Functions
Real Statistics Functions: The Real Statistics Resource Pack supplies the following functions:
KDIST(x, iter) = the value of the Kolmogorov distribution function F(x) where iter = the # of iterations used in calculating the infinite sum (default = 50).
KINV(p, iter0, iter) = the inverse of KDIST; i.e. KINV(p, iter) = x where 1 − KDIST(x, iter) = p. The inverse function is calculated from KDIST using iter0 iterations (default 40).
x takes values between 1.0 and 2.4 and p takes values between 0.0000198590086116779 and 0.269999671677355.
Observation
Based on the previous observation, for n sufficiently large, Dn,α = KINV(α)/SQRT(n), which yields the same result as the last line in the Kolmogorov-Smirnov Table (although with greater accuracy), and so
Dn,α = KINV(α)/(SQRT(n)+.12+.11/SQRT(n))
More Worksheet Functions
To avoid having to handle the SQRT(n) terms in the above expression, you can instead use the following Real Statistics functions for samples that are sufficiently large:
Real Statistics Functions: The Real Statistics Resource Pack supplies the following functions:
KSDIST(x, n) = the p-value of the one-sample Kolmogorov-Smirnov test at x for samples of size n
KSINV(p, n) = the critical value at p of the one-sample Kolmogorov-Smirnov test for samples of size n
Actually, the first of these functions takes the form KSDIST(x, n, b, iter) and the second takes the form KSINV(p, n, b, iter0, iter), where
KSDIST(x, n, , TRUE, iter) = 1-KDIST(x*(SQRT(n) +0.12+0.11/SQRT(n)), iter)
KSDIST(x, n, , FALSE, iter) = 1-KDIST(x*SQRT(n), iter)
KSINV(p, n, , TRUE, iter0, iter) = KINV(p, iter0, iter)/(SQRT(n)+.12+.11/SQRT(n))
KSINV(p, n, , FALSE, iter0, iter) = KINV(p, iter0, iter)/SQRT(n)
b = TRUE (default) works better for small values of n, but when b = FALSE then it is assumed that n is sufficiently large so that the approximation described previously is sufficient. Note that the third argument in the above functions is used for the two-sample Kolmogorov-Smirnov test.
Observations
For Example 1 of Kolmogorov-Smirnov Test, where the sample size n = 1,000, we have
D1000,.05 = KSINV(.05, 1000) = KINV(.05)/(SQRT(1000)+.12+.11/SQRT(1000)) = .04278
which is pretty close to the value shown in cell G16 of Figure 3 of Kolmogorov-Smirnov Test. Referring to this figure, we can also calculate the p-value as follows:
p-value = KSDIST(G15,B14) = 1–KDIST(0.011706*SQRT(1000)) = .999167
Note too that D10,.05 = KSINV(.05, 10) = .4094 which yields the value calculated above via the formula =KINV(.05)/(SQRT(10)+.12+.11/SQRT(10)).
References
Ferguson, T. (2008) The Kolmogorov distribution
No longer available online
Wicklin, R. (2020) Kolmogorov D distribution and exact critical values
https://blogs.sas.com/content/iml/2020/06/24/kolmogorov-d-distribution-exact.html
Dimitrova, D. S., Kaishev, V. K. and Tan, S. (2017). Computing the Kolmogorov-
Smirnov distribution when the underlying cdf is purely discrete, mixed or continuous
https://www.jstatsoft.org/article/view/v095i10
Hi Charles
I need a favour from your side..
I have to compare two dataset of different Metrices(don’t have common metrices) to find out the common metric among them. But i am not able to do that.Please help me to do that
Hello Rashmi,
You can use the two-sample Anderson-Darling test to determine whether the two data sets come from a common population. See
Two-sample Anderson Darling Test
Charles
Dear Charles,
first my thanks for your very useful work and great helpfulness.
I have one small request: Since many of your functions are approximations, it would be very helpful if you could provide, alongside the definition, an indiction of the set of arguments over which they are valid. As an example, I have been plotting the KDIST function to understand it better, and found that it explodes below x = 0.05 (while it behaves just fine for x > 0.05). I suppose KDIST was not meant to be used for such small arguments, but there is no indication of this on the site.
Similarly, since the set of images of KINV is [1;2.4], the relationship “KINV(p, m) = x where 1 − KDIST(x, m) = p” holds only for x in [1;2.4]; outside this interval the expression KINV(1-KDIST(x)) returns nonsensical results. Turning this around, the expression “1-KDIST(KINV(p))” only works correctly for p in [0;0.27], which leads me to the conclusion that KINV should indeed only be used for arguments smaller than 0.27 (i.e. the inverse for the left branch of the distribution function is not modeled) – but again I have found no indication of this on the site.
Thanks!
Steffen,
Good suggestion. I have just added the correct limits to the webpage.
Thanks for helping to make the website more easy to understand.
Charles
Hi Charles, I’m triying to emulate a function to calculate this distribution based on the result you have mention (KSDIST(G15,B14) = 1-KDIST(G15*SQRT(1000)) = .999167.)
nevertheless I’m getting a quite different value when using my function.
could you help me known what I’m doing wrong?
Public Function KSDIST(x As Variant, Optional n = 1000) As Variant
Dim check As Boolean
Dim t As Variant
t = Sqr(8)
check = False
If x <= 0 Then
check = True
Else
Dim F As Variant, k As Variant, R As Variant
F = 0
R = Application.SqrtPi(2) / x
For k = 1 To n Step 1
F = F + (1 / (Exp((2 * k – 1) * Pi) / (t * x)) ^ 2)
Next k
KSDIST = R * F
End If
If check = True Then
MsgBox "x must be a positive number"
Exit Function
End If
End Function
Result KSDIS(0.011706,1000)=234.7407 🙁
Julio,
Do you think that the result that is provided on the website is incorrect?
Charles
No Charles, not at all, I think I´m doing something wrong but now I see it is an issue of parenthesis.
Thanks!
I found a different definition of Kolmogorov distribution when searching in google but in russian.
Coul you please tellme if this function is equivalent to the one you used?
Public Function KSDIST(x As Variant, Optional n As Variant = 1000) As Variant
‘Function that provides either KS Distribution p value or ks distribution value at x
Dim F As Variant, i As Variant, y As Variant, R As Variant
F = 0
For i = -n To n Step 1
F = F + (-1) ^ i * Exp((-2 * (i * x) ^ 2))
Next i
KSDIST = F
End Function
Hi Charles
How would I calculate the K-S D statistic against the random (Poisson) distribution, compare calculated D with Dα=0.05, and claim if the point pattern is clustered or not
Thank you
David,
You do this as described on the referenced webpage. Do you have a specific question?
Charles
Hi Charles – I was looking to build my own KS distribution without the use of the KSDIST and KSINV function. Would you have a quick guide on how to code it in excel or a formula?
Hi Doc,
You just need to program the formula given on the referenced webpage. Since it is an infinite sum, you will need to make a finite approximation.
Charles
Hi Charles,
Do you know how to do 2D K-M Test for two samples? Have you prepared such a function in Excel?
Sorry Sohrab, but I have not created a 2D Kolmogorov Smirnov test in Excel.
Charles
Thank you for responding but do you know if I can do the test in R or MATLAB or other software?