Omnibus Test
The Kruskal-Wallis H test is a non-parametric test used in place of a one-way ANOVA. Essentially, it is an extension of the Wilcoxon Rank-Sum test to more than two independent samples.
Although, as explained in Assumptions for ANOVA, one-way ANOVA is usually quite robust, there are many situations where the assumptions are sufficiently violated, and so the Kruskal-Wallis test becomes quite useful: in particular, when:
- Group samples strongly deviate from normal; this is especially relevant when sample sizes are small and unequal, and data are not symmetric.
- Group variances are quite different because of the presence of outliers
Note that, as discussed in Assumptions for ANOVA, the actual normality assumption for one-way ANOVA is that the residuals are normally distributed (see also Example 1 below).
If the assumptions of ANOVA are satisfied, then the Kruskal-Wallis test is less powerful than ANOVA, and so you should use ANOVA. This is also the case when a transformation can be used to meet the ANOVA assumptions. When the homogeneity assumption fails, Welch’s ANOVA is often preferred over the Kruskal-Wallis test.
Assumptions and Characteristics
Some characteristics of the Kruskal-Wallis test are:
- The assumptions are similar to those for the Mann-Whitney test: independent group samples, data in each group are randomly selected, and data are at least ordinal
- No assumptions are made about the type of underlying distribution, although see below
- Each group sample has at least 5 elements.
- Note that no population parameters are estimated, and so there are no confidence intervals.
Interpretation
The Kruskal-Wallis test is actually testing the null hypothesis that the populations from which the group samples are selected are equal in the sense that none of the group populations is dominant over any of the others. A group is dominant over the others if, when one element is drawn at random from each of the group populations, it is more likely that the largest element is in that group.
H0: the group populations have equal dominance; i.e. when one element is drawn at random from each group population, the largest (or smallest, or second smallest, etc.) element is equally likely to come from any one of the group populations
H1: At least one of the group populations is dominant over the others
When the group samples have the same shape (and so presumably this is reflective of the corresponding population distributions), then the null hypothesis can be viewed as a statement about the group medians.
H0: the group population medians are equal
H1: the group population medians are not equal
An indication that the population distributions have the same shape (except that possibly there is a shift to the right or left among them) is that the box plots are similar, except that the box and whiskers among them may be at different heights. Another indication is that the group histograms or QQ plots look similar (although not necessarily indicating normality).
Test Statistic
Property 1: Define the test statistic
![]()
where k = the number of groups, nj is the size of the jth group, Rj is the rank sum for the jth group, and n is the total sample size, i.e.
![]()
Then
![]()
provided nj ≥ 5 based on the following null hypothesis:
H0: The distribution of scores is equal across all groups
Observations
If the assumptions of ANOVA are satisfied, then the Kruskal-Wallis test is less powerful than ANOVA.
An alternative expression for H is given by
![]()
where 
}")
If there are small sample sizes and many ties, a corrected Kruskal-Wallis test statistic H’ = H/T gives better results where
![]()
Here the sum is taken over all scores where ties exist, and f is the number of ties at that level.
Example
Example 1: A cosmetic company created a small trial of a new cream for treating skin blemishes. It measured the effectiveness of the new cream compared to the leading cream on the market and a placebo. Thirty people were put into three groups of 10 at random, although just before the trial began, 2 people from the control group and 1 person from the test group for the existing cream dropped out. The left side of Figure 1 shows the number of blemishes removed from each person during the trial.
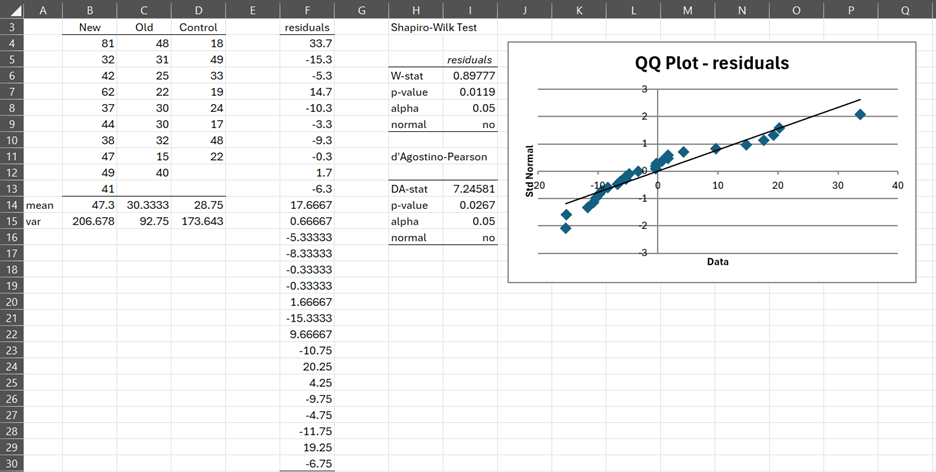
Figure 1 – Blemish treatment data
Testing Assumptions
We list the residuals for the ANOVA data in range F4:F30 using the array formula Anova1ResX(B4:D13). Based on the Shapiro-Wilk test, shown on the right side of the figure, we see that the residuals are not normally distributed. This conclusion is confirmed by the QQ plots. We, therefore,, decide to use the Kruskal-Wallis test instead of ANOVA.
From the box plots shown in Figure 2, we observe that although the group distributions don’t have the same shape (consistent with the fact that two are not normally distributed, while one is normally distributed), their shapes are fairly similar (although the values for the New group are larger than for the other two groups). Thus, we can use Kruskal-Wallis to test the null hypothesis that none of the groups is dominant over the others, and perhaps even that the group medians are equal.
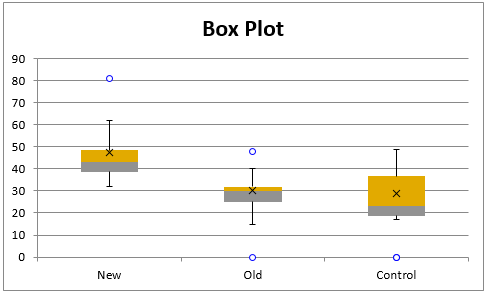
Figure 2 – Box plot comparisons
Test
We now carry out the Kruskal-Wallis test as shown in Figure 3. Using the RANK.AVG function (or the RANK_AVG function for Excel 2007 users), we obtain the ranks of each of the raw scores, as shown in range G4:I13. E.g. cell I4 contains =IF(ISNUMBER(D4), RANK.AVG(D4,$B$4:$D$13,1),””).
We next calculate the sum of the ranks for each group, namely R1 = 199, R2 = 96.5,, and R3 = 82.5. Next, we square each of these values and divide by the number of elements in the corresponding group to obtain the figures shown in range G16:I16. The remaining formulas in the figure are shown in column L (corresponding to formulas in column J).
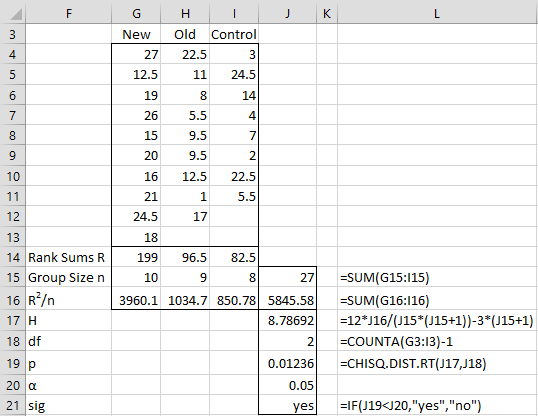
Figure 3 – Kruskal-Wallis test
Since p-value = .01236 < .05 = α, we reject the null hypothesis and conclude there is a significant difference between the three cosmetics.
Alternative Approach
Note that we can perform a one-way ANOVA on the ranks (i.e. the data in range G3:I13) using Excel’s ANOVA: One Factor data analysis tool (or the Real Statistic data analysis tool) to find SSB. This provides an alternative way of calculating H (see Figure 4) since H is equal to
![]()

Figure 4 – ANOVA on ranked data
Worksheet Functions
Real Statistics Functions: The Real Statistics Resource Pack contains the following functions:
KRUSKAL(R1, ties) = value of H on the data (without headings) contained in range R1 (organized by columns).
KTEST(R1, ties) = p-value of the Kruskal-Wallis test on the data (without headings) contained in range R1 (organized by columns).
When ties = TRUE (default), then a ties correction is applied.
For Example 1, KRUSKAL(B5:D14) = 8.7869 and KTEST(B5:D14) = .01236.
The resource pack also provides the following array function:
KW_TEST(R1, lab, ties) = the 4 × 1 range consisting of the values for H, H′, df, p-value. If lab = TRUE, then an extra column is added containing labels. If ties = TRUE (default) then H’ is used to calculate the p-value; otherwise, H is used to calculate the p-value.
Data Analysis Tool
Real Statistics Data Analysis Tool: The Real Statistics Resource Pack provides a data analysis tool to perform the Kruskal-Wallis test.
To use the tool for Example 1, press Ctrl-m and double-click on Analysis of Variance (or click on the Anova tab if using the Multipage interface) and select Single Factor Anova. When a dialog box similar to that shown in Figure 1 of ANOVA Analysis Tool appears, enter B3:D13 in the Input Range, check Column headings included with data, select the Kruskal-Wallis option, and click on OK.
The output is shown in Figure 5.

Figure 5 – Kruskal-Wallis data analysis
The H′ value (including a ties correction) can be calculated by =KRUSKAL(B4:D13) and the corresponding p-value by =KTEST(B4:D13). In fact, the range Z12:Z15 can be calculated by =KW_TEST(B4:D13).
Follow-up Tests
If the Kruskal-Wallis Test shows a significant difference between the groups, then pairwise comparisons or contrasts can be used to pinpoint the difference(s) as described following a single-factor ANOVA. It is important to reduce familywise Type I error.
For more information about these follow-up tests and how to perform them in Excel, click on any of the following links:
- Nemenyi Test
- Dunn’s Test
- Schaich-Hamerle Test
- Conover Test
- Steel Test
- Pairwise Mann-Whitney tests
- Contrasts
Links
Examples Workbook
Click here to download the Excel workbook with the examples described on this webpage.
References
NCSS (2012) One-way analysis of variance
https://www.ncss.com/wp-content/themes/ncss/pdf/Procedures/NCSS/One-Way_Analysis_of_Variance.pdf
Hollander, M., Wolfe, D. A. (1999) Nonparametric statistical methods, 2nd ed. Wiley
Lomuscio, S. (2021) Getting started with the Kruskal-Wallis test
http://library.virginia.edu/data/articles/getting-started-with-the-kruskal-wallis-test
Hallo dear charles,
Thanks for explaining Kruskal wallis test very nicely. I am a PhD student in plant pathology and i am studying the resistance of different plant varieties to a fungal disease. I monitor the lesions on the plant´s stem (length of leasion L, girdling G and profundity P) each in classes from 1-9 then i but them in an equation to find the volume of diseased tissue (HR=1-P/9 and then
Volume of Diseased Tissue VDT=(1-HR^2)*G/9*L.
i had two reasons to apply kruskal wallis test. First, I supposed that my results of VDT are still categorial after applying the equation. Second, the normal distribution was violated in many varieties so i could not apply ANOVE. My basic Problem is that i can not explain what does it mean to have significant results in the concret situation in my experiment (Probably it means that the means of ranks are from different distribution) but still in my expirement i can not put it in words. Also in my presentation, how can i present my results in Graphs? i am using XLSTAT, should i present the means of ranks and put the letters that show significant differences above them? or can i use the means of the value. My supervisor told me that he is interested to see a graph with the means of VDT and not of the ranks. and now i do not know how to present a correct graph.
Thanks alot in advance for your help.
Best regards,
Dima
Dima,
1. The null hypothesis being tested by the KW test is: The distribution of scores is equal across all groups. This means that the group samples are coming from populations with the same distribution (including their parameters).
You don’t need to mention ranks when stating the hypothesis.
2. The graphs should be of the data and not the ranks.
Charles
IN Non-Parametric tests One-Sample Tests when and why we have to use the following tests
Sign Test
Test of Randomness
One Sample Run Test
Test of Turning Points
Kolmogorov–Smirnov
Two-Sample Test
The Mann–Whitney U-Test
The Median Test
The Kruskal–Wallis Test
The McNemar Test
Kendall’s coefficient of concordance
F statistic
Chi-square tests
Kumera,
The answer to these questions can be found on the website. You can insert the name of each test in the Search field (on the right side of the display) to get the information you are looking for for that test.
Charles
Hi!
I recently did an experiment where I incubated cells in 4 different types of conditions. I repeated the experiment 3 times and measured the expression of certain genes by qPCR.
Now I would like to compare these expression levels to each other. Would this test be the one that I need? I have seen other publications use one-way ANOVA, but if I only have 3 samples in each group then I can’t really assume they’re from a normally distributed population, right?
Kati,
With only 3 samples in each group, you shouldn’t expect much from any test, but you can check to see whether each group is reasonably symmetric (in lieu of normality), and if so use one-way ANOVA. The key assumption for ANOVA is not normality, but homogeneity of variances.
Charles
Charles,
I am working on a data set that has three columns and four rows for data that i am trying to run KW analysis on (i’m assuming this is correct because of the small sample set). I am only interested in the interaction between c1/r1 vs. c1/r2 vs. c1/r3 vs. c1/r4 and so forth with column 2 and 3. Once i run the KW test i then need to run some sort of follow up analysis to see if there is significant difference between r1/r2/r3/r4 for each column. Can you help me perform this? or point me in the right direction to where i could look.
Thanks!
Brad,
See the following webpage regarding KW follow up tests:
Follow-up tests to Kruskal-Wallis
Charles
Charles,
The list of follow-up tests do not have any tests that perform within groups, only between groups. I want to be able to run the KW test within each group, then run the post hoc to match. Does this make sense?
Thanks
Sorry Brad, but I don’t understand what you mean by running the KW test within groups. The KW test is a between groups test.
Charles
Charles,
Is there a test similar to the KW test that allows me to test within groups? I am only use KW because of my small sample size, but please advise if there is something else that i can use that i am not aware of.
Thanks
Brad,
I am not able to give you a definitive answer based on the limited information I have about the scenario you are trying to address. Some possible tests are two-way ANOVA, MANOVA, repeated measures ANOVA, Friedman’s Test, Scheier-Ray-Hare test. All of these are described on the website.
Charles
Great post! Have nice day ! 🙂 zuadt
Hi,
Could you please help me to apply krushal -walis test for my analysis.
Obj: to determine the effect of exercise on body fat in the obese subject.
I have two groups control and exercise group, both have an equal number (n=10). I measure for pre and post exercise. How KW can be applied to see the difference in means between and within the groups. This KW test is requested by my SV because of small sample size.
I would be thankful, if someone can provide me the answer for my question.
Anna,
This sounds like a fit for two factor ANOVA. One factor is a fixed factor (control and exercise) and the other is a repeated measures factor (before vs after). KW does not handle this. If you are not interested in the interactions then you can use KW based on one factor with 4 levels: Control/Before, Control/After, Exercise/Before, Exercise/After. How you perform the analysis is described on the referenced webpage.
Charles
Hello Charles,
Could you please help me. I have dependent variables like Brand of cars, color of cars, price range of purchased car all these are further categorised into more than two categories like Maruti, Toyota, and Hyundai etc., Red, White, silver, and Black etc., Below 50000, 50001-75000, 75001-1000o and above etc.
and Nominal Independent variables like socio-economic characteristics like gender, education occupation etc…and psychological characteristics are find out through asking 18 items that are measured on 7-point Likert scale and after factor analysis of these psychological characteristics I have got 4 factors that affect as a psychological factors to my respondents for purchasing cars. what statistical techniques I can use to analyse my data of 300 respondents. Test of normality is not supported as well as test of homogeneous variance is also violated.
Hello Mandeep,
What hypotheses are you trying to test?
Charles
Hello,
I want to know how I can see the percentage from the groups after I did the kruskal-wallis test?
I hope someone can help me out!
Thnx
Denise,
What sort of group percentages are you looking for?
Charles
Hi,
Could you please help me about the issue.
Can I use factor scores as a dependent variables in KW test?
If I can, have you any academic reference about the issue?
Best Regards,
Tehran
Tehran,
You can use factor scores in any statistical test that uses numeric data, including the KW test. Any book on factor analysis will state this. There is nothing special about the KW test. Whether or not doing this makes sense in your situation, I can’t say.
Charles
Hello Kay
I like ur analysis. Please I’m advised to use kruskal wallis for my data analysis on
The impact of petroluem prices on road users in a particular metropolis, and I intend
using 4 locations. I have 2 objectives for this study; 1. To find out how
petroleum prices have affected rosd users. 2. To find out what can be done to the
different petroleum prices. Now the thing is, how will my questionnaire look like?
My supervisor wants atleast 15 questions.
I hope somebody can help, because I really don’t know anymore what to do. Since my distribution is not normal, I have to use the Kruskal-Wallis test, but the distributions have different shapes. What should I do? Can I use the Welsch test in this case? Is the Welsch test good even when the distributions have similar shapes?
Karmen,
You can use Kruskal-Wallis even when the group distributions have different shapes, but you won’t be able to conclude that the medians are the same or different. Instead you can us KW to test whether the mean ranks are equal.
Charles
Dear Charles,
Thank you so much for your very helpful site! I was hoping you could help me select the most appropriate test for my data. I have two disease groups (A and B) with 10 patients in each (A1-A10 and B1-B10) and each patient has provided samples from different blood vessels (called P, H and V ). I.e. A1 has a A1-P, A1-H and A1-V. Also the data is all non-parametric, I think,
I’m looking to measure two things:
1) The difference between the vessels within a disease group i.e. A-P v A-H and A-V. I was thinking of doing a Friedman for this as
2) The differences between the diseases per vessel i.e. A-V compared to B-V – I was thinking of doing a Mann-Whitney U
I was also considering doing a nested ANOVA to check for the differences too. I would really appreciate any thoughts you have!
Best wishes,
Kay
Kay,
When you say that your data is “non-parametric”, I assume that this means that some important assumption of the appropriate parametric test (probably some version of ANOVA) has been violated. Under this assumption, I will make the following comments:
1) Friedman’s test seems appropriate. A possible post-hoc test would be Wilcoxon’s signed ranks test (using a Bonferroni correction factor)
2) Mann-Whitney seems reasonable in this case. I am not sure what sort of nested ANOVA you had in mind, but I thought that your data wasn’t suitable for using a parametric test, such as ANOVA.
Charles
Charles
Hello,
I am trying to examine the relationship between work experience and a score of how usable an application is. I have 4 work experience groups (Less than 1 year, 1-2 years, 3-5 years, and 6-10 years). There is a score for each study participant and a corresponding work experience group. Sample=12. I want to to a Kruskal-Wallis analysis. Is this correct? If so, what post hoc test would I do afterward? Thank you!
Sara,
What hypothesis do you want to test?
Charles
Dear Charles:
Thank you for providing the useful resource. I finished an experiment but not sure which test should be used for analysis. I’d appreciate greatly if you could give me comments.
Two patients, three treatment, no carryover effect, monitoring a certain blood parameter
Three treatments were randomly implemented. One session (treatment and monitoring) was conducted every three days, and each treatment was repeated 5 times, resulting in 15 monitoring findings for each patient. The treatment order, for example, is BABCCBAABBACCAC. I want to know which treatment affects the blood parameter more than the other treatments.
Thank you so much!
Jack Yang
Thank you for
Jack,
If I understand you correctly, your situation is like that in Figure 1 of https://real-statistics.com/anova-repeated-measures/two-within-subjects-factors/, except that you only have two subjects and 5 timeframes instead of just two (pre and post).
If so, you shouldn’t use Kruskal-Wallis, but Repeated Measures ANOVA.
The problem you will have is that you only have two subjects, and so you shouldn’t expect too much from your analysis.
Charles
Thank you Charles. I suppose I could regard these two subjects as Case 1 and Case 2, and use the idea of single-subject research (https://www.researchgate.net/publication/256425889_Single-Case_Research_Design_in_Pediatric_Psychology_Considerations_Regarding_Data_Analysis)
If so, I analyse the data of these two subjects separately.
Do you think it’s appropriate if I use KW test or Resampling for ANOVA (https://real-statistics.com/one-way-analysis-of-variance-anova/resampling-anova/)?
Thank you!
Jack Yang
Jack,
This all depends on what you are trying to test. My initial reaction is that the KW test was not the appropriate one, but this really depends on aspects of your research that I am not aware of.
Charles
Very useful, my thanks for sharing this… I have put my data through with the software downloaded to apply this tes (Kruskil-wallice) and it carrie out the function. However, my p value keeps returning as 3.26731E-07…
Am I missing some stepts prior?
Tim,
3.26731E-07 is simply .000000326731 in scientific notation. This is a very small number and means that you have a significant result.
Charles
Charles,
I went through the whole of the Q&A above. None specifically addressed my questions that I would like to put forward. I would like to analyze my dv(there are 33of them) across 4 groups of years of experience in teaching, however 1st group has 29 respondents, 2nd gp has 111 respondents, 3rd gp has 59 respondents and 4th has only 4 respondents. Will I get a reliable result with KW test if i omit/remove the 4th group from the analysis? Pallant suggest KW should be reported using median but when i read through many blogs and the you tube videos, ranked mean seems to be a better option to be reported as the differences are obvious. If the results could be reported using ranked mean, would you please include the APA format for reporting (couldn’t find any example). I also noticed that some of the bloggers perform KW using 2 groups each time with 3 different combinations as post hoc test. I tried performing both KW and later Mann Whithey U test for every dvs and noticed that KW test gives values closer to the p=.05. When using Bonferroni correction for alpha value, none gives me a significantly different result. Is this possible, if possible how should I report this result? Or should I just drop this particular research objective?
I’m just a beginner and taking baby steps in my endeavour. Thank you very much for reading my predicament and your guidance is very much.
Sincere regards,
Parames
Parames,
Happy to help (at least where I can).
1. You can remove the 4th group from the analysis, but you should report this when presenting your results.
2. You can certainly report the group medians, but you should be cautious of how you interpret the results. If the group distributions are similar, then the KW test will test equality of medians, but if the groups are not similarly distributed, then the test doesn’t really test equality of group medians.
3. KW with two groups is equivalent to Mann-Whitney
4. If you use the KW test, then you should choose one of the post-hoc tests described on the referenced webpage
https://real-statistics.com/one-way-analysis-of-variance-anova/kruskal-wallis-test/
5. You should be able to report the KW test results more or less as you report ANOVA with the logical changes. I don’t know of a specific APA format for KW, but there is one for ANOVA.
Charles
Thank you very much Charles. Your suggestions were very helpful. Sorry for the very very late thank you note.
Glad I could be of some help to you.
Charles
Hello,
I am currently trying to perform analysis on some data. I have a categorical variable with 9 categories and a continuous variable (this is the dependant variable)- the data is not evenly distributed so i opted to use a Kruskal Wallace instead of an ANOVA. However i only have a single mean value for each of the categories. For example for my first category, parity 1 i have an average number of piglets born based on 387 pigs of 10.46.
Originally there was 30+ pieces of raw data in each set which were averaged out for each of the categories and provided to me in the data set. Unfortunately i no longer have access to the original raw data. Whenever i try and use software ( GraphPad Prism ) to analyse this it will not provide me with a result due to the lack of data values i have to analyse.
Is there a way i can resolve this / different test which would be more relevant or is this too much of a problem to be solved?
Thanks
I don’t know anyway to perform such a test without the original data.
Charles
Hello,
Could you inform how to test assumption of homogeneity of variances for Kruskal-Wallis test is met?
Thanks,
Mohideen
Mohedeen,
Depending on how you plan to use the KW test, homogeneity of variances is not a requirement. See the following webpage regarding how to interpret this test:
http://influentialpoints.com/Training/Kruskal-Wallis_ANOVA_use_and_misuse.htm
Usually Welch’s test gives better results when the homeogenity of variances assumption (on the original data) is not met.
Charles
Thanks a lot.
Charles
Thanks for your all your help so far. I’m having trouble with your ties correction equation for my H value. The equation you have detailed seems to be different to the output of your add-in. Your equation says n^3-n but the output formulae reads n^2(n-1) any advice would be greatly appreciated.
Ryan,
You are correct. The formula should read n(n^2-1). The difference in the output is usually not great, and for now you would need to correct the formula manually. I will correct this in the software shortly. Strangely, the ties formula used on the referenced webpage is the right one and so gives the correct value.
Thank you very much for finding this error. I really appreciate your help.
Charles
Hi Charles,
I get a negative number for H so I can’t get p-value and I receive an error. What should I do?
Best,
Negin
Negin,
I don’t think it is possible to get a negative number for H. I suggest that you double check your calculation.
If you send me an Excel file with your data and analysis, I will try to figure out what is happening. You can get my email address at
Contact us.
Charles
Hi Charles,
I have done the calculation and definitely got a negative H value – I have six different conditions (with roughly 25 values for each condition so totalling 166 individual values). I have checked my calculation many times. What do you think?
Thanks, John
Hi Charles,
I have worked out why I got a negative value for H – it was an issue with the ranking equation I put into the Excel cell. Have changed it and now it works! No longer a negative value! Just needed to sleep on it I guess!! Many thanks, John
Thank you, Charles. You are very helpful, and I appreciate your time!
Hello,
Thank you again for your wonderfully informative pages. I am trying to do an ANOVA type test on a DV that is a Likert item, scale 1 – 5. I have two categorical IVs. I obviously cannot do an ANOVA, so I’m trying to do a Kruskal-Wallis. However, I fail the Levene’s homogeneity of variance test. I have tried to collapse my values in the DV (originally it was 1 – 6, but with only one observation at 6), and normalize the distribution by using a log10, all in vain. I keep failing homogeneity of variance. My questions are 1) is there another way to meet this assumption that I am missing, and 2) if I have to give up on Kruskal-Wallis, what is an alternative? I have successfully done an ordinal regression on the data, but I think an ANOVA-like test is better to tell my story. Any help is much appreciated. Thanks!
Thomas,
Without seeing your data, it is difficult for me to comment in detail, but I can say that when the homogeneity of variances assumption fails often a good solution is to use Welch’s Test. This is described on the website.
Charles
Thank you. Let me try that.
Thank you for the response. Two things:
1. My dependent variable is a likert item, i.e., ordinal data. Welch’s is working with a parametric dependent variable. Can I take the log10 of my dependent variable and use that as the DV for such a test?
2. I see from this post and others that Welch’s mainly is a one-way ANOVA test. However, I have two independent variables. I have seen articles that mention it is feasible to use Welch’s as two-way, but I’m not seeing how.
Thank you VERY much for your help!
Tom
Tom,
1) You can certainly make such a transformation. Whether the test is useful depends on whether its assumptions are met after making this transformation.
2) I am not familiar with a two-way version of Welch’s test. There is a two-way version of Brown-Forsythe’s test (see http://www.jstor.org/stable/2529238). There is also a two-way version of Kruskal-Wallis’s test, which I described on the following webpage:
Scheirer-Ray-Hare
Charles
Hi Charles,
Many thanks for this wonderful program!!
I am comparing body composition of three groups of athletes and have used the Kruskal Wallis. I wanted to do the Dunn test as follow-up but have got a Mac so unfortunately this was not possible, so I opted for the Pairwise difference on average rank as you described. I just want to know If I should apply the Bonferroni correction to the alpha I am using in the formula’s for the Pairwise difference on average rank calculations. Your help will be much appreciated.
You don’t need to apply a Bonferroni correction in this case.
Charles
I need help from these many people. currently I am doing my M.Sc. thesis but I am wrong with Kruskal wallis test. plz anyboday can help me.
I tried a lot with Kruskal wallis Test but I lend up wrong. it was tested between number of small mammals and microhabitats ( ROcks, down logs, grass, litters , shrubs and trees). So if any one can help me i would be very grateful. I am ready to share that data.
Charles,
Thanks for making this quick summary/tutorial. It’s been really useful. I’m trying to decide if this is the right test for me to run. I’ve got data from a randomized complete block experiment. The sample size is pretty large (81 blocks, 405 observations, 5 treatments). I wanted to run it as a normal ANOVA, but I can’t seem to get the residuals normalized for two of my response variables (even after using a boxcox transformation). So, I figured since it violated the assumption of residual normality I had to start looking for nonparametric alternatives. I don’t know very much about nonparametric designs, so this tutorial has been really useful. My question is whether Kruskal-Wallis, Friedman, or some other test that I haven’t figured out yet is most appropriate.
Again, thanks so much for any advice you have.
Be well,
Ryan
Ryan,
ANOVA is quite robust to violations of normality, and so unless the data is far from normal I would use ANOVA. If you have a completely random design, then you can use Kruskal-Wallis if the normality assumption is not met (although Welch’s Test is better if the homogeneity of variance assumption is not met). Friedman’s test can be used if the normality assumption is not met in case of repeated measures design or random complete block.
Charles
Good day Charles,
Can I still use KW test if the sample size in each group is small (2~6)?
Thanks
You can always run the test with such a small sample, but unless the effect is very big, you shouldn’t expect too much from the test. You should expect that the power of a test with such a small sample will likely be very low.
Charles
Hi Charles,
your plugin is really awesome and I work a lot with it to analyze large datasets. However, it can be very laborious to reorganize my data tables so that the individual samples are sorted by columns like it is required by the ktest formula. Could it be possible to modify the formula so that i can select individually the samples to be tested (i.e. ktest=(B2:B11,B12:B21,B22:B31). Many thanks! Fabian.
Fabian,
You can do something like this by choosing Kruskal-Wallis data analysis tool and selecting the standard (stacked) format.
Charles
Hi Charles,
Your site and toolbox have been great resources! I have a question:
I am trying to analyze grade distribution data for a specific course over 3 semesters for different student majors. I have counts for total number of letter grades given A-F, and I want to group the counts according to college majors. The distribution is non-parametric (it is nearly binormal, with most students getting A’s).
I’m interested in seeing if there is a test for significance for the individual letter grades over time and/or per major. For example, say 26% of business majors, 25% of psych majors, and 29% of nursing majors received A’s in 2000, and 19%, 20%, and 17% got A’s in 2001…how do I tell if these differences are significant between majors for each year, and if the total number of A’s is significant when compared year to year? I was thinking Kruskal-Wallis since it is non-parametric?
Hope that makes sense…
Thanks!
Hi Ken,
Kruskal-Wallis is a non-parametric version of one-way ANOVA. Thus you can use it say to compare the percentage of A’s between different majors in one year. It is not a multiple factor test and so you can’t tell if there are significant differences between majors in multiple years. It is not a repeated measures test and so you can’t tell whether there are significant differences in one major by year; you can use Friedman’s nonparametric test to do this.
Charles
Thank you Charles for every topic in this web site. Simple and effective to learn and for my personal opinion one of the best.
Felix
I tried to use the KW-test from the Real Statistics Pack. Unfortunately I got different results with the KW-test in R and in Statistica.
p=.0201 (R)
p=.0200 (Statistica)
p=.0131 (Real Statistics)
I used the KW-test in the “ANOVA: Single Factor” window over 4 groups. Can you tell me what I am doing wrong? Maybe I can send you my testdata.
Sebastian,
Yes, please send me an Excel file with your data so that I can figure out what is going on.
Charles
Dear Charles,
did you get my mail from Tuesday? 😉
Thanks for your help!
Sebastian
Dear Sebastian,
Yes, I received it and will look at it soon.
Charles
Dear Charles,
thanks a lot! It works fine now with this adjustment of the data. Will you implement an automatical adjustment in the next release? this would be nice. Thanks again! I really appreciate this support! 🙂
Sebastian
Sebastian,
The adjustment that I suggested in the email to you is necessary due to a problem with how Excel has implemented the RANK and RANK.AVG functions. I will try to come up with new versions of these functions that correct the problem.
Charles
I should have noted the general form of the equation I found: α = 1–(1–.05)^(1/k), where k is the number of comparisons.
Alistair,
I understood that, but the formula should be α = 1–(1–.05)^k.
Charles
But 1-(1-.05)^2 is 0.0975, not 0.0253. Unless I’m missing something, either the equation is wrong or the solution is wrong.
Alistair,
Yes, you are correct. Sorry that it has taken me so long to understand. The exponent should be 1/2 instead of 2, just as you have said. I have now corrected this on the webpage. Thanks for your patience and for identifying this error.
Charles
No worries. I’m just glad it all got sorted out in the end.
Alistair
I forgot to mention in my last comment: There seems to be a problem with one of the equations given in the page. At the end of the second-to-last paragraph it says “this amounts to setting α = .05/2 = .025 (Bonferroni) or α = 1 – 1 – .05 = .025321 (Dunn/Sidák).” The α = 1 – 1 – .05 part must be missing something, though I’m not familiar enough with the Dunn/Sidak correction to know what it’s supposed to look like.
Alistair
Alistair,
Thanks for catching this typo. It should say α = 1–(1–.05)^2 =.025321 (Dunn/Sidák). I have now corrected the referenced webpage.
I really appreciate your help in making the website better.
Charles
I think the exponent should be ½ instead of 2. Otherwise the calculation gives 0.0975 instead of 0.0253.
Hi Alistair,
The exponent for the Dunn/Sidak correction is 2 and not 1/2. The resulting values should be pretty similar to the Bonferroni correction.
Charles
But (1 – 0.05) = 0.95, which raised to the power of 2 gives 0.9025, and then subtracted from 1 gives 0.0975. Whereas 0.95 to the power of ½ gives 0.9747, which subtracted from 1 gives your value of 0.0253. Am I missing something in the math? I found the form of the equation I’m using here: http://www.graphpad.com/guides/prism/6/statistics/index.htm?stat_the_method_of_bonferroni.htm
Hi Charles.
Thanks as always for your work here. I wonder if you can help with a question that has befuddled me for some time. It relates to the question of distributions needing to be “similar” for the assumptions of the Kruskal-Wallis or Mann-Whitney tests to be met. Does similar mean same general shape, or variability, or both? For example, say we have two samples, both right-skewed to the same degree (a skewness value of +3.0, for example). But the variance of one is five times that of the other. For purposes of K-W, are these similar? I’d like to be able to give my students some definitive advice on when they can use these rank-based tests versus needing to look for another solution.
Thanks,
Alistair
Hi Alistair,
I believe that similar includes homogeneity of variances. See, for sample, the following paper
http://www.ncbi.nlm.nih.gov/pubmed/10710850
For two samples, if the data if not too skewed, you can use a t test (with Welch’s correction) or a transformation (e.g. log). For more than two samples, Welch’s ANOVA is often a good approach even with heterogeneous variances.
The Mann-Whitney test really tests the following null hypothesis:
H0: if one observation is made at random from each population (call them x0 and y0), then the probability that x0 > y0 is the same as the probability that x0 < y0.
If this is what you require then I don't believe that homogeneity of variances is an issue.
Charles
Thanks, Charles. It looks like the robustness of these rank-based methods is less than I’d been led to believe by some older texts. Based on my reading of this paper – http://www.ncbi.nlm.nih.gov/pubmed/19247980 – I’m going to be much more circumspect in recommending the ranks approach to students, instead suggesting that they use a transform and/or Welch’s method whenever possible.
Alistair,
That sounds correct to me.
Charles
Hi Charles,
I have problem with calculating the p value,
because of som reason ist just dont work.
I tried with =CHIDIST (for example: =CHIDIST(G17:G18); =CHIDIST(G17,G18); etc.) fuction, but it shows me error.
Can you tell, yhat can be a problem?
Thank you wery much.
The CHIDIST function takes the form =CHIDIST(x, df). The examples you gave don’t have two arguments and the first argument can’t be a range.
Charles
Dear Charles,
I am analyzing a data set collected from course catalogs of various institutions of higher education. I am trying to learn more about their online offerings in a discipline. My three groups are the types of institutions (2-yrs, 4-yr public, 4-yr private). Samples sizes are 16 or 17 institutions per group. I had planned to examine differences between the mean number of online courses offered between these groups using ANOVA. However, the data do not appear to be normally distributed (many institutions in one of my groups do not offer any online courses in this discipline) and because of all of the zeros, the variances are quite different. Would it be appropriate to analyze these data with a Kruskal-Wallis Test? If so, with a significant result, would it be appropriate to follow up with Mann-Whitney test for pairwise comparisons if I use a Bonferroni correction?
Thanks for considering my questions!
Alison
Alison,
Since the homogeneity of variances assumption is violated, Welch’s test is usually the preferred test to use. You can follow up the Games-Howell test. Both of these tests are described in the Real Statistics website.
Charles
Hi Charles,
What if the data also appear to have a non-normal distribution? Which test, Kruskal-Wallis or Welch’s ANOVA, is more robust when both of these assumptions appear to be violated?
BTW, I have done the analysis three ways now
-ANOVA followed by Bonferroni-corrected contrasts
-Kruskal-Wallis followed by Mann-Whitney U contrasts
and
-Welch’s ANOVA using Games Howell for contrasts.
I get the same results either way.
Thanks for your feedback!
Alison
Alison,
You asked which test is better when both of these assumptions are violated, but you have only listed one assumption, namely normality. I assume that the other assumption is homogeneity of variances. When this latter assumption is not met, Welch’s ANOVA is usually chosen over KW. I don’t know how robust Welch’s is to violations of normality, but usually these sorts of tests are much more sensitive to violations of the unequal variance assumption. Another approach is bootstrapping.
The the following is an article that may shed some more light on the situation:
http://home.cc.umanitoba.ca/~kesel/Cribbie_param_bootstrap_feb_2010.pdf
Charles
Is it possible to get p-value with confidence interval for Kruskal-Wallis test? Your articles states that there is no confidence interval for Kruskal-Wallis, but my paper reviewer insists I need to put one, together with p-value ( I have adjusted p-value for it, but not CI)
Please, let me know!
Mike,
I can think of two approaches to getting a confidence interval. One is to construct an exact test, similar to the way I have done it for Wilcoxon Signed-ranks or Mann-Whitney. The other is to conduct resampling, as I have done for one sample and two sample tests of the median or for ANOVA. I believe that SAS provides a confidence interval, probably associated with the exact test.
Charles
Could you please suggest me, if it is possible for krushal -walis test that we can consider same set of subjects for each group. e.g. same subjects (subject 1 to subject 10) from population.
In above example in this thread:
We have three groups e.g. new cream, old cream and placebo, to see the effects of new cream in comparison to the available creams. Could we apply these treatments or creams to same set of subjects for Krushal-walis test to see the difference in means between the groups.
I would be thankful, if someone can provide me the answer for my question.
If you want to use the same subjects you should consider Friedman’s test instead.
Charles
Dear Charles,
Thank you for your reply. I was using this test before but now will implement Friedman’s test on my database. In this test if I am not wrong, we need to rank based on columns ( groups) for each subject separately.
I have one more question and I think it would be fine with you if I can ask you about my doubt for Anova test in this page.
For Anova test, assumption is that sample distributions should be normal and if our distributions are not normal we need to apply non-parametric tests e.g. krushal or Frideman.
But I was looking into some of the examples in a statistical toolbox, where they applied the Anova tests for sample data without normal distribution.
Could you please suggest me, it is fine if we apply the Anova test even when our sample distributions are not normal.
In my results, results are good for non-parametric sample distributions using Anova. I am confused, if it is a right way to report our work and to use this test for non-parametric sample distributions.
Thanks,
Mehak
Mehak,
Anova is pretty robust to violations of the normality assumption. This means that unless the data is quite skewed the test should work pretty well even if the normality assumption is violated. More important is the homogeneous variance assumption. If the groups have very different variances then you should consider using a different test. In this case the Welch’s test is probably the best choice with independent samples.
If you have repeated samples, then you shouldn’t use the ordinary ANOVA but the ANOVA with repeated samples instead.
Charles
Dear Charles,
I really appreciate you for your quick reply to my query and to clear my doubt. I have spent almost one week to search for the solution of my problem and yesterday by chance I looked into your this blog. This blog is very helpful and thank you for providing us your help with such a productive answers to our problems.
Related to my problem, I have used the Anova for three different groups (score1, score 2 and score3) with same subjects for each group. It would be kind of you, if you can provide me the feedback for one of my basic question. I do not want to conclude my results based on wrong assumptions. My main question is related to sample data. Could we select same subjects for each group in anova. Example Same subjects (Subject 1 to Subject 50) for each group.
We can also use the post hoc tests after the parametric tests and non-parametric tests. I am planning to do the post hoc test after the Anova and Friedman test. Would it be fine if I will use these tests for further investigation.
Thank you
Mehak
Dear Charles,
Will the Kuskal-Wallis test give reliable results if one group is very large compared with the others ? In one dataset I’m analysing, we’ve got one group of roughly 500 individuals, another of about 100, then 3 groups of 15-50 each. Intuitively, it would seem that the one very large group would dominate the overall “structure” of the rankings, making it less likely that the smaller groups could have significant influence.
I realise there is no requirement that the groups should be of the same size, but do the assumptions of the test break down (say) in the limit where one group gets extremely large whilst the others become tiny ?
Gordon,
I don’t know of any breakdown in the KW test when the group sample sizes are very different, but I can’t answer your question definitively.
Usually in the case of unequal sample sizes, the statistical power tends to be reduced since the power is more affected by the smaller sample than the larger samples. I don’t know whether this is true for the KW test, but it is probably the case.
Charles
Dear Charles,
Thank you for your unvaluable help on statistics. I made a survey with several questions using 5-point scale (likert scale) on six different groups (between 12 to 17 people each groupe). I want to know if there are differences between groupes for each question. So, 1. Do I use Krutal Wallis test first and then pairwise comparisons by using the Mann-Whitney test ?
2. What kind of test should I use to evalute correlations between questions (Spearman test)?
Thank you so much,
Juan
Juan,
1. Kruskal-Wallis is a reasonable approach. If there is a significant result then you can follow up with Mann-Whitney (probably using a Bonferroni correction factor). If KW test doesn’t yield a significant difference, then you don’t need to do pairwise MW tests.
2. Spearman’s is good, but Kendall’s is probably better.
Charles
Thanks for the answer. I have another question.
In some questions one groupe presents bimodal distribution. The other groups present unimodal distribution in general. Can I use Krustal in those conditions ?
Juan,
For the KW test to be valid the group distributions should have similar shape. The validity of the test depends on how strongly is this assumption violated. If you have decided not to use ANOVA because of non-homogeneity of the variances, then you are probably better off using Welsh’s Test instead of KW.
Charles
Dear Charles,
Actually, I decided not to use ANOVA because my data is ordinal (questions using 5-point scale on six different groups between 12 to 17 people each groupe). So, despite this, can I use Welsh’s test ?. If not, what could I use when I have unimodal and bimodal distribution and I need to know if there is a significant difference ? Just visual inspection (histogram) is enough ?
Thank you
Juan,
Likert scales although technically ordinal are often considered to be interval (or even continuous). The more scales (e.g. 7-point vs 5-point) the better this assumption is. The following is a link to an article that compares various options for handling Likert scales in ANOVA-like tests.
http://digitalcommons.wayne.edu/cgi/viewcontent.cgi?article=1774&context=jmasm
Charles
I collected tree density data which is grouped in to three ( they are count data) and i want to analyses this data so which test statistics is appropriate for me i am thinking of Kruskal-Wallis test so is there any one who help me !!!
Elias,
You haven’t provided enough information to answer your question. Depending on the details, you might use ANOVA, Kruskal-Wallis or Friedman.
Charles
Hello Charles,
Thank you first of all for your efforts and time for putting up your knowledge in this web-page and that too in such easy language. It’s been very helpful. But even then, I have some doubt on whether ‘kruskal wallis test’ should be considered as the most appropriate one to measure the difference in the dataset I have. Please help me out with this doubt.
I have a dataset comprised of 30 items (viz., 30 rows) in total. It has been collected for 4 types of items (viz., 4 columns). The problem is, some of the rows for some of the columns are blank in them (viz., no data for certain items). The columns contain 17 non-blank rows for column 1, 6 for column 2, 8 for column 3 and 13 for column 4; but for any row i, not all the 4 possible column j – are populated, as stated earlier. No Std-Dev. values are given, only the Mean values were used to populate this (aforementioned) sparse-table. A look with the naked-eye suggests that there are differences in these 4 columns. It seems to me that the ‘kruskal wallis test’ would be appropriate to measure the extent of their differences – am I right? Moreover, should I do some other tests (say, 6 Wilcoxon Rank-sum tests, takng pairs of 4 columns)? or something else? .. Please let me know your opinion.
Thanking you
Sourav
Sourav,
You can perform the Kruskal-Wallis test even with some blank cells or blank rows. In fact, the example I give on the referenced webpage has some blank cells. The test just ignores all the blank cells. It is important that the types of items (i.e. columns) are independent; otherwise you might want to consider the Friedman’s non-parametric test.
Charles
Dear Charles
I am carrying out a survey and i want to test my hypothesis using kruskal – wallis test. My population size is 40 and my questionnaires have 6questions.
My responses to each questionnaire have five headings, but i do not know how to fit these data to the online software for calculating using the kruskal – wallis test,
Please help.
Please clarify your request. I understand that 40 people take a questionnaire consisting of 6 questions, but I don’t understand the 5 headings. Also what are you trying to test using Kruskal-Wallis?
Charles
Hi I have reported my results for the KW test as e.g. x2(3, N = 151) = 4.56, p = .229
I have been told I should report the ‘K statistic’
What is this and how do I find it? Or do I just need to rejig the above?
Thanks
Katie,
I believe this is what is called H on the referenced webpage. Some use the letter K instead of H.
Charles
Thank you Charles,
I was starting to think such a statistic didn’t exist!
So instead of x2 i should be reporting K then?
Katie
Katie,
I don’t know what X2 is. This is cell X12 in Figure 4 of the referenced webpage.
Charles
many thanks with this macro, I’ve already try with several statistic software, and come to this site.
I need to run 15 sample with 4 replicate. the sample result is ordinal ( 1 – 5). is this can be done with Kruskal – Wallis or have to use another statistical approach
Best Regards
Dicky,
If the 4 “replicates” are independent variables then you can use the Kruskal-Wallis Test. (You could use ANOVA if the assumptions are met). If the 4 “replicates” are not independent then you might look at Friedman’s Test instead of Kruskal-Wallis.
Charles
Dear Charles,
first let me thank you for your unvaluable help on statistics.
I’ve got a question about the p-value in my calculation. After I’ve done the k-w-test I got as p-value .37. At the same time the whole calculation was given as significant. How can this be? I thought p had to be smaller than alpha to be significant.
Could you enlighten me?
Robert,
If the p-value >= alpha then the sig should be equal to “no”. I just the tested the KW data analysis tool and it seems to work fine. Are you using the KW data analysis tool or something else? If you send me a spreadsheet with your data and analysis I will try to figure out what’s wrong.
Charles
Dear charles,
Many thanks for your nice explanation. i am working on review and I want to compare the mean of one parameter within nine groups in nine studies. moreover, for every groups I have mean, SD and sample size. I dont know with which software or formular I could define my statistics (ANOVA or Kruskal-wallis) for my analysis. because as you know most of the define statitics formular or software exclusively focuse on calculating based on raw data. I also check for “review manager” but it didnt work for only one study from every group. it would be your favor if you kindly help me in this regard. thank you
Mahboob
Mahboob,
Kruskal-Wallis is based on the ranks of the raw data. Since you don’t have the raw data you won’t be able to use this test.
You have enough information to use a Single Factor Anova, as follows. Suppose that you have k groups whose sizes are n1, n2, …, nk, whose means are m1, m2, …, mk and whose variances are v1, v2, …, vk. Now define m = the average of the means = (m1 + … + mk)/k and n = n1 + … + nk. Define SSW = v1*(n1-1) + … + vk*(nk-1) and SSB = (m1-m)^2*n1 + … + (mk-m)^2*nk. Define dfB = k – 1, dfW = n – k, MSB = SSB/dfB, MSW = SSW/dfW and F = MSB/MSW. Now use the test FDIST(F, dfB, dfW).
Charles
Hi!
I wonder if you could help me with my survey .
It’s about job satisfaction.
I have 4 factors namely Work Conditions, pyschosocial Factor, Work Culture and Leaders.I wanted to test the reliability so I did pilot testing with a total of 7 respondents.
Alpha is 94%.
But upon checking the alpha per factor some factor got really low alpha.
Would this mean I have to modify the questionnaire or just stick with it since the overall alpha is 94%?
Thank you so much
Valerie,
Does your survey have (a) four questions or (b) four factors (with each of the four factors having multiple questions)?
If your survey has four factors (option b), then you should generally not calculate Cronbach’s alpha on the survey with all the questions. The fact that you got a high alpha for the total questionnaire and a low alpha oon the questions for one factor is surprising to me.
If instead your survey has four questions (option a) and the overall alpha is high but the alpha with one questions missing is low, then this is also surprising to me, but indicates that that question has problems.
Charles
Hi Charles,
Suppose, one has performed Wilcoxon rank sum test along with the Kruskal-Wallis test. Does she need to perform the Mann-Whitney U Tests?
Thanks,
Chairul
Hi Chairul,
No. The Wilcoxon rank sum test is equivalent to the Mann-Whitney test.
Charles
Hey Charles,
First of all, tremendous work done on excel(stat tests) which is very rare to see. Can i get to see how to do Mood’s Median test and an example on excel?
Thanks
Uttam
Uttam,
I don’t currently support the Mood’s Median Test, but it is pretty easy to conduct such a test based on the chi-square test that is already supported. Suppose that you have samples S1, S2 and S3. First calculate the Median M of the combined three samples. Next create a 2 x 3 contingency table, where the first row consists of the number of elements in each of the samples which are bigger than M and the second row consists of the number of elements in each of the samples that are less than or equal to M. Now perform a chi-square independence test.
I will add this test to the website shortly.
Thanks for bringing this topic up.
Charles
Thanks for your reply. Please bring the Chi-Square Independence test as i need to complete the Moods Median test.
Uttam,
The chi-square test is available now from the software. I will add the Mood’s Median test in the next release of the software.
Charles
Uttam,
The latest release of the Real Statistics software supports Mood’s Median Test. See Blog for more information.
Charles
Could you please help me in finding why Kruskal Wallis test statistic is named as “H”?
Eldho Varghese
Sorry Eldho, but I don’t know why the Kruskal Wallis test statistic is named “H”.
Charles