A key aspect of Ridge regression is to find a good value for lambda. There are several approaches for doing this, although none of them is ideal.
Ridge Trace
One approach is to plot a Ridge Trace, whereby we plot the values of the coefficients for various values of lambda. With one plot for each coefficient. As we have noted previously, the higher the value of lambda, the smaller the coefficient values. We are looking for the smallest value of lambda where the various coefficient plots stabilize. We want the smallest such value since this will introduce the least amount of bias.
Suppose in a Ridge regression with four independent variables X1, X2, X3, and X4, we obtain the Ridge Trace as shown in Figure 1. It is a judgment call as to where we believe that the curves of all the coefficients stabilize. This seems to be somewhere between 1.7 and 17. It is desirable to pick a value for which the sign of each coefficient is correct. Since the coefficient of X4 crosses the x-axis near lambda = 17, such a value seems to be a reasonable estimate.
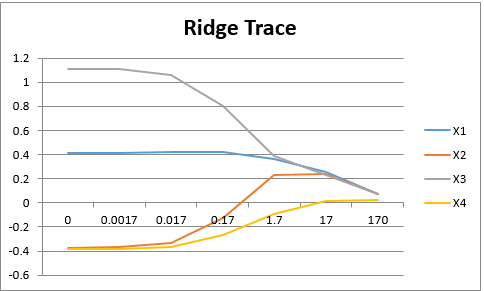
Figure 1 – Ridge Trace
VIF Estimation
Another approach is to find a value of lambda that ensures that all the VIF values are less than some designated value. As described in Collinearity, this value should be no bigger than 10, although a value of one or less is desirable. For lambda = .17, we see that the VIF values in Example 1 of Ridge Regression Example are still pretty high, the highest just above 16. We need to use higher values of lambda to reduce the VIF values.
Suppose our goal is to find a value of lambda that ensures that the VIF values are all less than or equal to one, We can find this value by trial and error using the RidgeVIF formula. Alternatively, we can use the following Real Statistics function.
Worksheet Function
Real Statistics Function: The Real Statistics Resource Pack provides the following function.
RidgeLambda(Rx, vif, iter) = returns the lowest lambda value for Ridge regression on the x values in Rx that generates a maximum VIF value less than vif; iter = the number of iterations in the search (default 25)
We note that =RidgeLambda(A2:D19,1) yields the value 1.55863, which means that a lambda value of about 1.558 will ensure that the VIF values of all four coefficients are less than 1.
Cross-Validation
There is also a procedure called k-fold cross-validation, whereby the data is partitioned into k approximately equal-sized groups. Typically, k = 5 or k = 10 is used. For any value of lambda and each value of j between 1 and k, we can calculate the Ridge regression coefficients based on the data in all the partitions except for the jth partition. We then use these coefficients to forecast the y values of the data in the jth partition and calculate the residuals for each data element
![]()
We now compute the error for the jth partition group as follows:
![]()
Finally, we calculate the CV error for the entire partition as
![]()
Our goal is to select the value of λ with the smallest CVErr(λ) value.
CV Worksheet Functions
Real Statistics Functions: To implement k-fold CV in Excel we use the following Real Statistics functions.
RandPart(n, k): returns a column array with n rows with the values 1, 2, …, k randomly distributed where the number of times each integer appears is approximately equal.
OrderedPart(n, k): returns a column array with n rows with the values 1, 2, …, k repeated as many times as necessary in that order.
SortedPart(R1, k): returns a column array with the same number of rows as R1 and containing the values 1, 2, …, k where the number of times each integer appears is approximately equal. The order of the values 1, 2, …, k is determined by the sort order in R1. The rows in the output containing 1 correspond to those rows in R1 containing the 1st, kth, 2kth, 3kth, etc. smallest elements in R1. Similarly, the rows in the output containing 2 correspond to those rows in R1 containing the 2nd, k+1th, 2k+1th, 3k+1th, etc. smallest elements in R1. Etc.
RidgeCVError(Rx, Ry, lambda, map) = the k-fold cross-validation error for lambda based on the Ridge regression for the standardized x data in Rx and standardized y data in Ry, where the partition is as defined by map, a column array with the same number of rows as Rx (and Ry) containing the values 1, 2, …, k where k = the number of columns in Rx and where each value occurs approximately an equal number of times.
Observations
Actually, RidgeCVError can output a k+1 × 1 column array whose first element is as described above, while the other elements are the cross-validation errors for each of the k partition elements.
Each of the functions RandPart, OrderedPart, and SortedPart returns a partition of the numbers 1, 2, …, n into approximately k equal-sized groups. If n = 12 and k = 4, then in fact each group will have exactly 3 elements (i.e. each of the numbers 1, 2, 3, and 4 will appear exactly 3 times). If, instead, n = 14 and k = 4, then the numbers 1 and 2 will appear 4 times while the numbers 3 and 4 will appear 3 times.
CV Example
We now conduct k-fold cross-validation for Example 1 of Ridge Regression Example, as shown in Figure 2, using 5 folds.
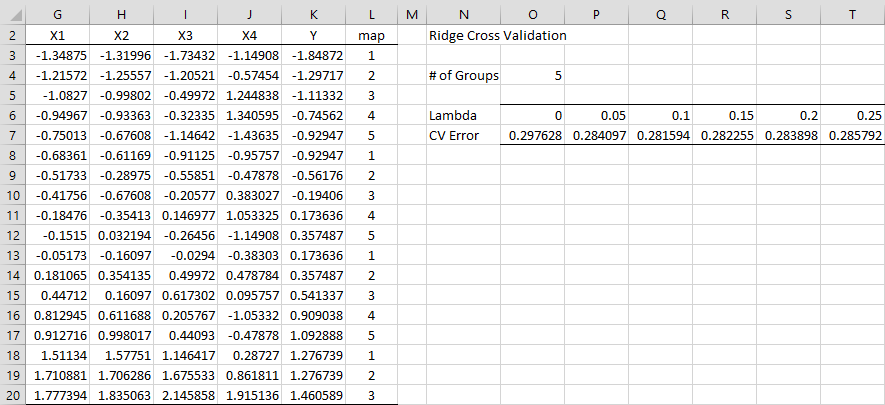
Figure 2 – Cross-Validation
The standardized data values from Figure 3 of Ridge Regression Example are repeated on the left side of Figure 2. We now choose to make an ordered partition of the data values. This may be accomplished by simply placing the values 1 through 5 manually in column L or by using the array formula =SortedPart(K3:K20,O4). Since the y values are already in sorted order, we would get the same values if we had used the array formula =OrderedPart(COUNT(G1:G29),O4). Alternatively, we can choose a random partition using the array formula =RandPart(COUNT(G1:G29),O4), although the results of our analysis would be a little different.
We next calculate the CV error for a range of lambda values as shown on the right side of the figure. E.g. the CV error for lambda = .5 is .284097 as shown in cell P7 using the formula
=RidgeCVError($G$3:$J$20,$K$3:$K$20,P6,$L$3:$L$20)
Comparing approaches
Of the values listed, it appears that lambda = .1 yields the smallest CV error. We can use Excel’s Solver to get an even better estimate of the lambda value. To do this, select Data > Analysis|Solver and assign the values Set Objective: P7, To: Min, and By Changing Variable Cells: P6. Upon pressing the Solve button, you get the values 0.106396 to P6 and .281574 to P7. Thus, lambda = 0.106396 is the preferred value based on this approach.
Note that each of the three approaches yields a different result. Once again, you need to use your judgment to select the value of lambda that minimizes the variance sufficiently while not adding too much bias.
Examples Workbook
Click here to download the Excel workbook with the examples described on this webpage.
References
bquanttrading (2015) Ridge regression in Excel/VBA
https://asmquantmacro.com/2015/12/11/ridge-regression-in-excelvba/
Marquardt, D. W. and Snee, R. D. (1975) Ridge regression in practice. The American Statistician
https://web.archive.org/web/20170809092848/http://www.jarad.me/stat615/papers/Ridge_Regression_in_Practice.pdf
PennState (2018) Ridge regression. Applied Data Mining and Statistical Learning
https://online.stat.psu.edu/stat857/node/155/
Good afternoon,
why doesn’t the Ridge Regression technique produce the standard errors (or t-stats) for the values in the “Ridge Trace”? It provides the estimated coefficients for each value of lambda, but you cannot tell if the coefficients are statistically significant at each value of lambda.
Hi Monica,
Yes, only the CV Error is reported. I guess if you really need the errors of the coefficients you could run the Ridge Regression model with the values of lambda that you are interested in.
Thank you for your comment. I will add this issue to my list of possible future enhancements.
Charles