The paired sample t-test is essentially a one-sample test on the differences between the paired sample elements. The same is true for the paired-sample sign test; namely, a sign test is done on the difference between the sample pairs.
Example
Example 1: An investigation of a new sort of aerosol was done to see how effective the spray was in removing resistant stains from a person’s skin. The stain intensity before and after the use of the spray is shown in Figure 1. Based on this sample data, is the aerosol effective in reducing the stain’s intensity?

Figure 1 – Paired sample sign test
We won’t go through the details here, but essentially we use the sign test described above on the sample differences shown in column D. It turns out that this data is not normally distributed (seen by using a QQ plot or Shapiro-Wilk test). It also contains a number of outliers, as seen by using a box plot with outliers (see Figure 2). All this moves us away from using a t-test.
The test yields a p-value = .007385, indicating that there is a significant difference between the before and after measurements. Since the median difference is a reduction of 8 units, this indicates that the spray is effective at reducing the stains.
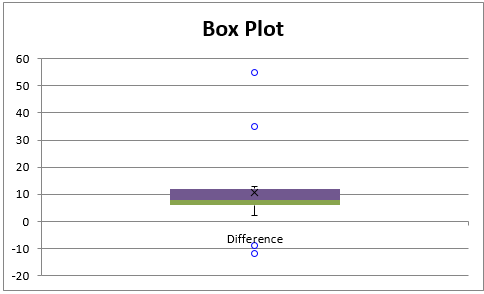
Figure 2 – Outliers in the differences
Examples Workbook
Click here to download the Excel workbook with the examples described on this webpage.
References
Stricker, D. (2016) Brightstat nonparametric tests
https://secure.brightstat.com/index.php?p=c&d=1&c=2
Howell, D. C. (2010) Statistical methods for psychology (7th ed.). Wadsworth, Cengage Learning.
https://labs.la.utexas.edu/gilden/files/2016/05/Statistics-Text.pdf
Woops. Never mind. Writing out the question made me understand what I was doing wrong. I don’t use the test statistic in the binom.dist function. It should be binom.dist(82, 187, 0.5, True) and then the answer is doubled because it is a two tailed test. That got me there.
Thank you for your help!
Hello again!
Is the method of finding the p-value the same for a sign test and a paired sample sign test? i.e. use the binomial.dist function?
Yes, that is correct. The paired sign test is the one-sample sign test on the differences.
Charles
Then I am doing something wrong, but I am not sure what.
The problem is: Use a 0.05 significance level to test the claim that there is a difference between female attribute ratings and male attribute ratings.
So, it should be a two tailed test. Alpha is 0.025
There are 82 – signs and 105 + signs. n=187
Using the alpha I get the critical values of -1.96, and 1.96.
Using the z= ((x+0.5)-(n/2))/((n^0.5)/2) I get a test statistic of -1.61. So far, so good, my answer matches the exercise.
Things go sidewise when I try to find the p value. I did binom.dist(1.61, 187, 0.5, True) I get 0.000, but the answer is supposed to be 0.1074. So, I am confused. Can you give me direction in what I am doing wrong? Probably something is wrong with how I am using the binom.dist function. But I don’t know what it is. Is the third value in the binom.dist function, incorrect? How do I go about finding the correct value?