On this webpage, we consider the situation where any of the regression coefficients can be set to a specific value or constrained by a lower and/or upper bound.
Example
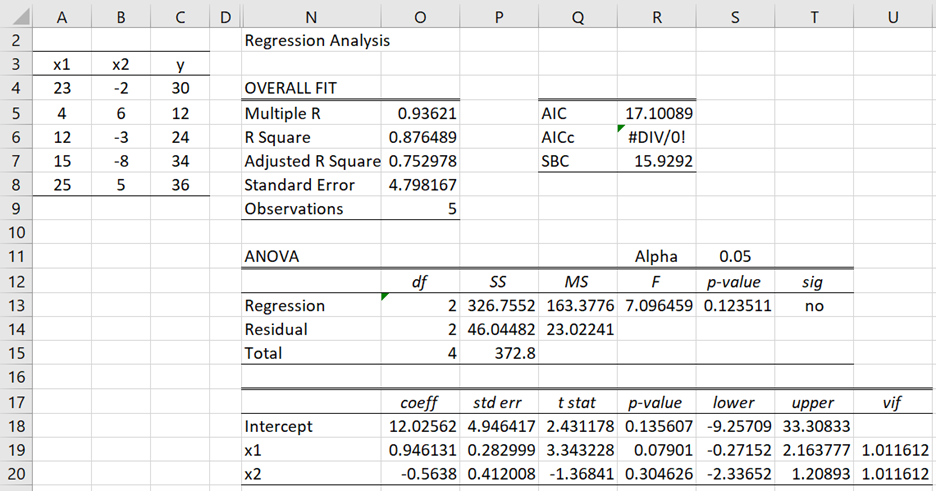
Example 1: Determine the coefficients b0, b1, b2 for the linear regression based on the data in range A3:C8 of Figure 1 subject to the constraints 12.5 ≤ b0 ≤ 14, 0.5 ≤ b1 ≤ 1.0 and -7 ≤ b2 ≤ -3.
Figure 1 – OLS Linear Regression
If there are no constraints, the coefficients are as shown in O18:O20 of Figure 1.
Solution using Solver
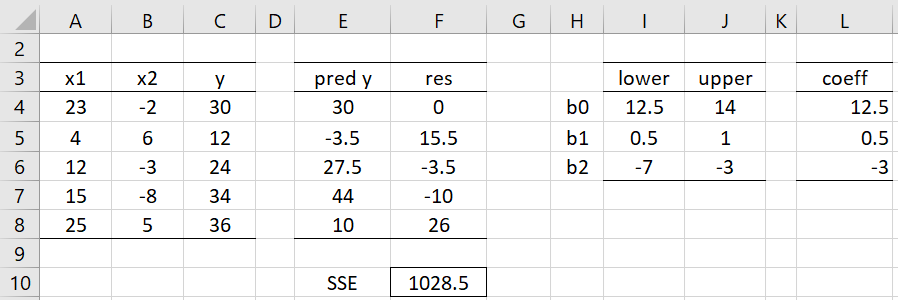
We now show how to calculate the constrained coefficients using Solver. First, we create the spreadsheet shown in Figure 2.
Figure 2 – Initialization
Our objective is to minimize SSE, i.e. sum of the squared errors (SSE). We initialize the coefficients in column L by taking the average of the lower and upper bounds shown in columns I and J. Note that cell E4 contains the formula =$L$4+A4*$L$5+B4*$L$6, F4 contains =C4-E4 and F10 contains the formula =SUMSQ(F4:F8).
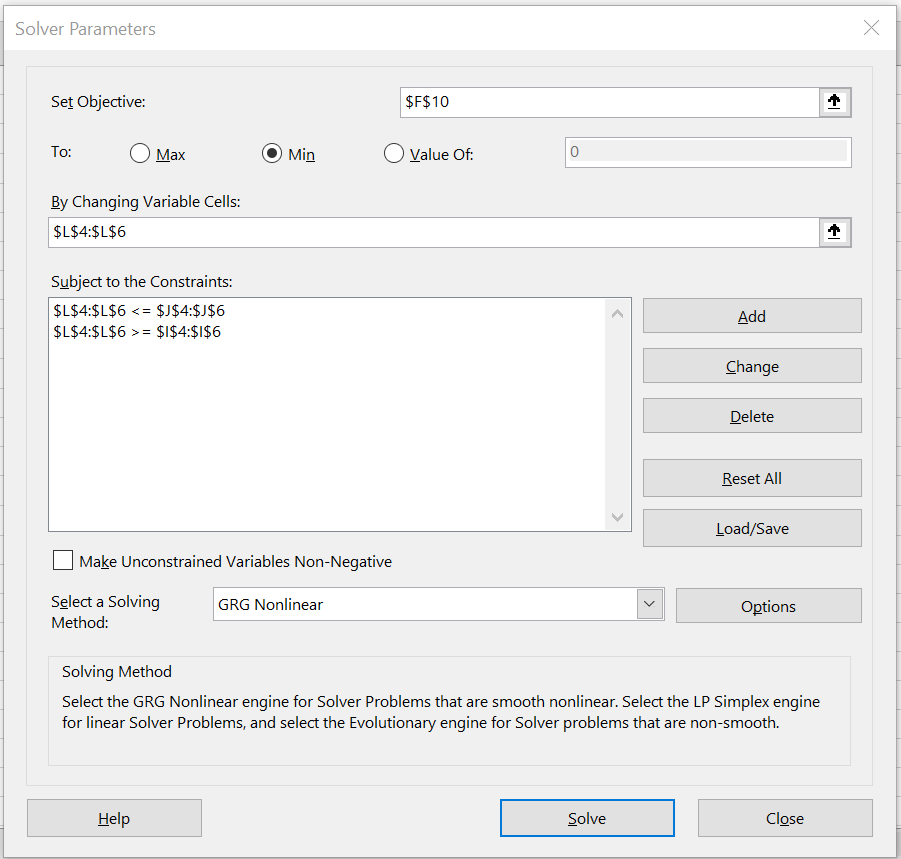
Next, we use Data > Analyze|Solver to display the Solver dialog box. We fill in this dialog box as shown in Figure 3.
Figure 3 – Solver dialog box
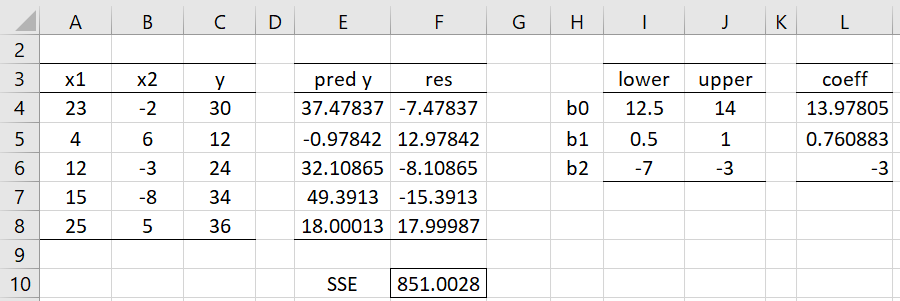
After clicking on the OK button the spreadsheet in Figure 2 changes to that shown in Figure 4. The bounded coefficients that we are seeking are shown in the range L4:L6. Note that the SSE in cell F10 has dropped from 1028.5 to 851. If we had used the coefficients from Figure 1, SSE would be even lower, namely 46.04, as shown in cell P14, but in this case, the coefficients for the intercept and x2 would not meet the specified constraints.
Figure 4 – Bounded coefficients
Worksheet Function
Real Statistics Function: The Real Statistics Resource Pack provides the following array function.
BRegCoeff(Rx, Ry, Rlower, Rupper): returns an n+1 × 1 column array with the regression coefficients based on linear regression with X values in the m × n array Rx and Y values in the m × 1 array Ry using the lower bounds for the coefficients in the n+1 × 1 column array Rlower and the upper bounds for the coefficients in the n+1 × 1 column array Rupper.
If you want a coefficient to take a particular value, then set both the lower and upper bounds for the appropriate coefficient to this value. It is assumed that the regression includes a constant term. If you want to exclude a constant term, then set the first element in Rlower and Rupper to zero.
If you only want to use a lower bound for a particular coefficient, then set the upper bound to a very large positive number. Similarly, if you only want to set an upper bound, then set the lower bound for this coefficient to a very large negative number.
Note that, referring to Figure 4, the worksheet array formula =BRegCoeff(A4:B8,C4:C8,I4:I6,J4:J6) produces a column array with the values 13.88377, .76685, and -3, which are almost the same as those produced by Solver. In fact, the SSE of 850.9924 for these values would be slightly better.
Examples Workbook
Click here to download the Excel workbook with the examples described on this webpage.
References
Lawson, C. L. and Hanson, R. J, (2014) BVLS code
https://netlib.org/lawson-hanson/all
Stark, P. B. and Parker, R. L. (1995) Bounded variable least squares: an algorithm and applications. Journal of Computational Statistics
https://digitalassets.lib.berkeley.edu/sdtr/ucb/text/394.pdf
Saraf, N. (2019) Bounded-variable least-squares methods for linear and nonlinear model predictive control
http://e-theses.imtlucca.it/296/1/Saraf_phdthesis.pdf


