Basic Concepts
We now consider an experimental design to determine whether there is a difference between two groups within the population. For example, suppose we want to test whether a new drug is effective in treating cancer. One approach is to create a random sample of 40 people, half of whom take the drug and half take a placebo. For this approach to yield valid results it is important that people be assigned to each group at random. Such samples are independent.
When the population variances are known, hypothesis testing can be done using a normal distribution, as described in Comparing Two Means when Variances are Known. However, population variances are not usually known. The approach we use instead is to pool the sample variances and use the t distribution.
We consider three cases where the t distribution is used:
- Equal variances
- Unequal variances
- Paired samples
We deal with the first of these cases on this webpage.
Key Property
Property 1: Let x̄ and ȳ be the sample means of two sets of data of size nx and ny respectively. If x and y are normal, or nx and ny are sufficiently large for the Central Limit Theorem to hold, and x and y have the same variance, then the random variable
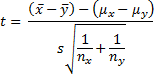
has distribution T(nx + ny – 2) where
![]()
s, as defined above, can be viewed as a way to pool sx and sy, and so s2 is referred to as the pooled variance. Also, note that the degrees of freedom of t is the value of the denominator of s2 in the formula given in Property 1.
Proof: Click here for a proof of Property 1.
Worksheet Functions
Real Statistics Functions: The Real Statistics Resource Pack provides the following worksheet functions.
VAR_POOLED(R1, R2) = pooled variance of the samples defined by ranges R1 and R2, i.e. s2 of Property 1
STDEV_POOLED(R1, R2) = pooled standard deviation of the samples defined by ranges R1 and R2, i.e. s of Property 1
STDERR_POOLED(R1, R2, b) = pooled standard error of the samples defined by ranges R1 and R2. This is equal to the denominator of t in Property 1 if b = TRUE (default) and equal to the denominator of t in Property 1 of Two Sample t Test with Unequal Variances if b = FALSE. When the sample sizes are equal, b = TRUE or b = FALSE yields the same result.
Each of these functions ignores all empty and non-numeric cells.
t-Test using Property 1
Example 1: A marketing research firm tested the effectiveness of a new flavoring for a leading beverage using a sample of 22 people, half of whom tasted the beverage with the old flavoring and the other half who tasted the beverage with the new favoring, although one person dropped out of the study before the tasting began. The people in the study were then given a questionnaire to evaluate how enjoyable the beverage was. Based on the scores shown on the left side of Figure 1, determine whether there is a significant difference between the perceptions of the two flavorings.
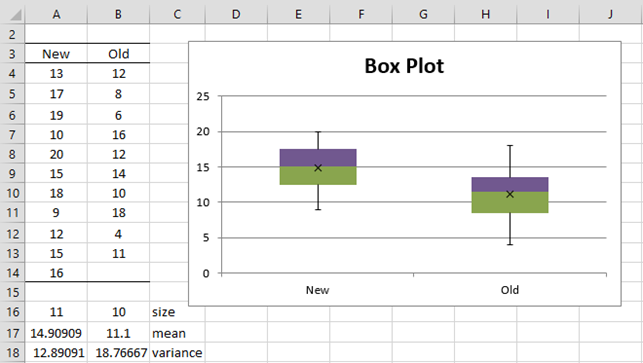
Figure 1 – Data and box plot for Example 1
As we can see from Figure 1, the mean score for the new formula is 14.9, while the mean score for the old formula is 11.1, but is this difference just due to random effects or is there a statistically significant difference?
We also note that the variances for the two samples are 12.9 and 18.8. It turns out that these two values are close enough to satisfy the equal variance assumption.
Finally, when we draw the box plots for the two data sets we see that each is relatively symmetric (i.e. for each sample, the colored areas in each box are approximately equal in size and the upper and lower whiskers are fairly equal in length).
Thus, the assumptions for the t-test are met, and so we can carry out the test using the following null hypothesis:
H0: μ1 – μ2 = 0; i.e. there is no difference between the two flavorings (two-tailed test)
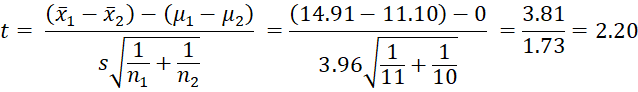
Since the sample variances are similar we decide that the population variances are also likely to be similar and so apply Property 1.
![]()
and so s =
![]()
Since p-value = T.DIST.2T(t, df) = T.DIST.2T(2.20, 19) = .04 < .05 = α, we reject the null hypothesis, and conclude there is a significant difference between the two flavorings. In fact, the new flavoring is significantly more enjoyable.
Note that VAR_POOLED(A4:A14,B4:B13) = 15.67, STDEV_POOLED(A4:A14,B4:B13) = 3.96 and STDERR_POOLED(A4:A14,B4:B13) = 1.73.
Data Analysis Tool
We can also carry out the t-test for Example 1 by using the following Excel data analysis tool.
Excel Data Analysis Tool: Select Data > Analyze|Data Analysis and then choose the Two-Sample Assuming Equal Variances option from the dialog that appears. Next, fill in the dialog box that appears as shown in Figure 2.
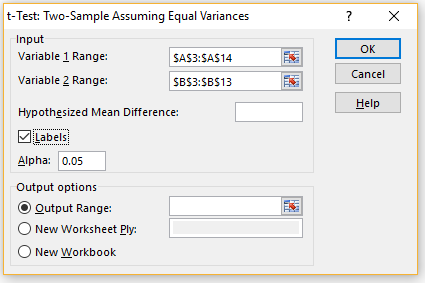
Figure 2 – t-Test dialog box
After pressing the OK button, the results shown in Figure 3 appear.

Figure 3 – Data analysis tool output
Note that the results are the same as those calculated by hand.
Real Statistics Data Analysis Tool
The Real Statistics Resource Pack also provides a data analysis tool that supports the two independent sample t-test, but provides additional information not found in the standard Excel data analysis tool. Example 3 in Two Sample t Test: Unequal Variances gives an example of how to use this data analysis tool.
Another Example
Example 2: To investigate the effect of a new hay fever drug on driving skills, a researcher studies 24 individuals with hay fever: 12 who have been taking the drug and 12 who have not. All participants then entered a simulator and were given a driving test that assigned a score to each driver as shown on the left side of Figure 4.
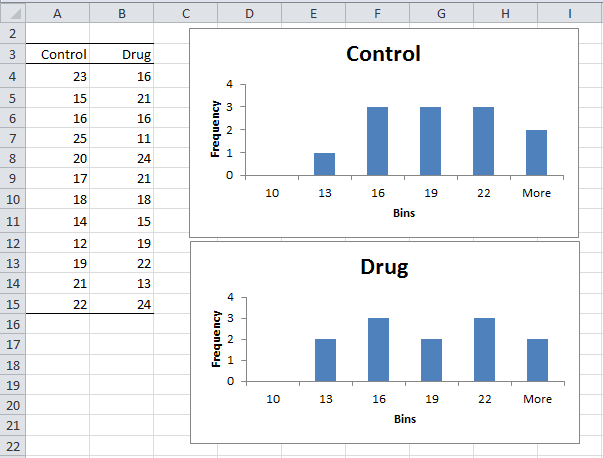
Figure 4 – Sample data and histograms for Example 2
Checking Assumptions
As in the previous example, we plan to use the t-test, but especially with a sample this small, we first need to check that the data are normally distributed (or at least symmetric). The shape of the histograms on the right side of Figure 3 is not too far off from that of a normal distribution. Also, the variances are relatively similar (15.18 and 17.88), and so we can again use Excel’s t-Test: Two-Sample Assuming Equal Variances data analysis tool to test the following null hypothesis:
H0: μcontrol = μdrug
Click here for more information about the test assumptions.
Analysis Results
The results are shown in Figure 5.

Figure 5 – Two sample data analysis results
Since tobs = .10 < 2.07 = tcrit (or p-value = .921 > .05 = α) we retain the null hypothesis; i.e. we are 95% confident that any difference between the two groups is due to chance.
Confidence Interval
The confidence interval for the difference between the two population means is defined in a similar manner as in the one-sample case, namely
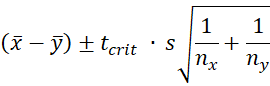
where s is as in Property 1.
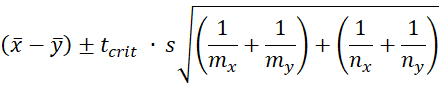
Prediction Interval
If new samples are drawn from the two populations of size mx and my, then the prediction interval for the difference between the new sample means is
Effect size
Click here for a description of Cohen’s d and Hedges’s g effect size measures for the two-sample t-test. In addition, an estimate of the confidence interval for Cohen’s d is provided.
Examples Workbook
Click here to download the Excel workbook with the examples described on this webpage.
References
Howell, D. C. (2010) Statistical methods for psychology (7th ed.). Wadsworth, Cengage Learning.
https://labs.la.utexas.edu/gilden/files/2016/05/Statistics-Text.pdf
Nelson, S. L. and Nelson, E. C. (2016) How to use the t-test data analysis tool in Excel
https://www.dummies.com/article/technology/software/microsoft-products/excel/how-to-use-the-t-test-data-analysis-tool-in-excel-152093/
When alpha is not given in a case problem, shall I presume Excel PHStat’s default, 0.005? Please help. Thanks. Marisse
The usual default is 0.05.
Charles
Pls l have 20 test variables(likert scale type questions) and 2 independent variables. what is the best statistical tools
to use. thanks
Kemmy,
This depends on what you want to test. It is not possible to give an answer without more information.
Charles
Hi,
I want to find out the difference in students attitude from 2 different types of school.
The survey, which comprises of 21 questions uses 4-point likert scale.
May I know how do I analyse it ?
Is it suitable to use a t-test?
I would appreciate if someone can help.
Hannah,
If you create an overall score based on the responses to the 21 questions, then you can use a t test.
If you want to analyze the differences for all the questions, then you might want to use ANOVA followed by comparisons, Tukey HSD, etc.
Charles
Hi!Iam checking the difference of the observed and practiced leadership of a certain organization. The observed leadership came from the 53 members who answered a survey and the practiced leadership came from the 18 officers who also answered the same survey though statements was written in the first person. I tried to test it in excel by using data analysis of unequal variance however I noticed that the df varies from one statement with another. Then I tried data analysis again and used t test for equal variance and the df stayed the same on all statements. What test should I really need to use?eThanks
Ethel,
Whether to use the t test for equal variance or t test for unequal variance depends on the the variances. When in doubt use the t test for unequal variance.
When you say that “the df varies from one statement with another”, I understand that you are doing a separate t test for each statement. If this is the case, then there is no problem having different values for the df for each test.
Depending on the details of what you are analyzing, you might want to try one of the following approaches:
1. Create an overall score based on all the statements (or some groups of statements) and do a t test on these scores
2. Use ANOVA, or more likely MANOVA, where all the statements are tested simultaneously. This may cut down on the expermentwise error rate of performing a number of t tests.
Charles
Hi Charles,
I want to establish the effectiveness of an intervention. I have scores of students who have given both pre-test and post-test. However, there are some students who have given a pre-test and not the post-test and students who have given a post-test and not a pre-test. What method should I use that accounts for this anomaly.
Note: A pre-test and post-test were also given to a control group of students who showed no improvement in scores. All other conditions between the intervention group and the control group can be assumed to be identical.
AG,
For the types of analyses you describe in the first paragraph of your comment, you would use a paired t test (and not a two independent samples t test). You would eliminate any subject who were not given both the pre-test and post-test.
Charles
Hi!
I have data for schools scores and one variable tells me if the school had a treatment to improve their score. the treatment group is about 3000 and the not trated group is about 11000. Can i simple do the two sample t test equal variance or before i have to select a random sample of 3000 schools from the 11000?
sorry for my english
Saludos!!
Mark,
The sizes of the two samples don’t have to be equal. You can simply perform a two sample t test. If the variances are not too different you can use the equal variances version of the test; otherwise use the nonequal variances version of the test.
Charles
I am working on a project where i have data from two different groups comparing the efficacy of a new procedure vs conventional method. 30 subjects in each group. i have a followup of them 6months down the line and the data for each group of subjects on 6months. how can i find the p value using t-test and which one- unpaired t-test assuming equal/unequal variances??
also when can we assume variances equal or unequal-in one of your articles it was written that if one variance is upto 4times the other it can be taken as equal. is that true??
kindly guide me as your help will be beneficial.
thanks
Dr M,
With the t test when in doubt it is probably best to assume that the variances are unequal. Even if the variances are equal, the p-value won’t be much different.
If the variance of one sample is no more than 4 times (some say 3 times) the variance of another sample, then you can generally assume that the variances are sufficiently equal, is a rule of thumb. Generally it works, but it is not a hard and fast rule.
Charles
i have administered intelligence test and achievement test . The total marks of both the test of individual students have been arranged in ascending order and rank them from higher to lower order . Each two adjacent scores will constitute a pair will be randomly assigned as control group and experimental group . In this manner 30 pairs have formed . The control group will be taught by traditional method of teaching and the experimental group will be taught by activity method of teaching . For significant difference which t test formula shall i used pl . suggest me . My id gitanjalipadhi@Yahoo.in . Plea
Since the 30 students in each group are different you should use the two independent sample t test. The pairing that you have done is not used.
Charles
Dear Charles,
I would like to ask you which test I should use in this situation:
I taught two groups of 30 students both (approximately the same level): one group was taught deductively, and the other one – inductively. Then they had a test. I am going to compare their means and then if I want to see if the difference in their scores is significant (or not), could I use a paired T_test? Or should i use a different test?
Thank you very much,
Ina
Ina,
Assuming that the 30 students in each group are different, then you would typically use the two independent sample t test, not the paired t test.
Charles
Thanks a lot
Hi Charles
I want to ask which test I should use in this situation: I want to study the difference of classroom tasks with regard to motivation. Therefore, my independent variables are the different tasks (~23) and the dependent variable is motivation. Over a period of several lessons I had students (~30) fill out a short questionnaire marking on a scale from 1 to 5 how motivated they are when doing a specific task. I calculated the mean value for every task and now I want to test whether each task is significantly different from the average of all tasks. I learned that to do a two-sample t-test, the two populations must be independent, all subjects must have produced the same amount of data (though I’m not quite sure what that means…) and the variables must be ratio variables. In my study the different tasks are independent but they are always done by (almost) the same group of students, however, since not all students were present every single time and I also had to exclude some questionnaires because they weren’t complete, the number of subjects differs for each task. Can I use the two-sample t-test or is there another test that would be more suitable? I must say I’m quite confused and hope you can help me. Thank you!
Nicole
Nicole,
If you want to compare all 23 tasks, then you need to use a multivariate version of the t test, namely Hotelling’s T-square test. Since the two samples are not independent but involve the same students, you need to use the paired version of this test. See the following webpages for information about this test:
Hotelling’s T-Square
The problem then is that you need complete data. This means that you need to use one of the techniques for dealing with missing data. See the following for more information about this:
Handling Missing Data
Charles
Hi Charles,
I have a case where I have to apply both the Independent and Paired designs, and part of the tasks to conduct both designs are;
– Based on the information you were given, determine which of the two experimental designs is more efficient, that is, which experimental design yields a higher power in detecting the 8% increase in the tires’ mean lifetime.
-Investigate how the power of the tests in the two experimental designs vary according to the number of experimented tires, ????, and the errors variance, ????????2.
And I’m confused in what I have to do, like does the “power” refer to the CI?
Thanks.
You need to look at the power of the two types of t tests. This is not the same thing as confidence interval. The 8% is related to effect size.
See, for example, the webpages
Power and Sample Size using Real Statistics
Power of T Tests
Statistical Power
Charles
I have some inquiry to ask. I have been doing biomonitoring, where I get 5 sets of data for 5 stations, and I take three readings of each water parameters for each station. I had get the mean and standard deviation for the three readings. Do I have to find variance too?
I am required to do t-test to analyze the data. But, I didn’t see where I should do the t-test since t-test is comparison between 2 populations and mine is 5 population. I hope that you can help to to understand this. Thank you.
Daisy,
It sounds like you have been given an assignment where you need to apply the t test despite the fact that you have 5 samples. I can’t explain why someone might want you to do this. Also I can’t guess as to whether or not you are required to provide the variance for this assignment.
Charles
when u have met to cheack the equality of two population mean then u will always apply t- test its confirm but when u have involve the testing of more than two population mean then u always apply “ANOVA TEST”…………..the reason behind this that when u will apply t-test for the testing of more than 2 population mean than your level of significance alpha
will increase which is not suitable and its consuming more time and it has tedious to calculate…………………
please Charles
I want to know why we assume that two variance must be equal in case of t-distribution?
and in case the two variances unknown and not equal why we use?
Allam,
We don’t need to assume that the variances are equal. If we have evidence to believe that the variances are equal then we can use the t test with equal variances. Otherwise, we should use the t test with unequal variances; in this case, if the variances are actual close to being equal, then the results from this test will be quite similar to those of the equal variances version of the t test.
Charles
thanks Charles, but we we use different rules, one by sample variance and another by pooled variance.
(S1^2)/n1 +(S2^2)/n2
SP^2 (1/n1 +1/n2 )
Note that if the variances are equal and the sample sizes are equal, then these formulas are the same.
Charles
Dear Charles,
I am analyzing the t-Student test to perform some statistical analysis on some data. My experiment is something like: I will record three movements with a Camera 1 and with a different Camera 2 and retrieve data from the position of the elbow. So what I want is to compare the position of the elbow measured with Camera 1 with the position measured with Camera 2, for each movement. So:
Movement 1: Camera 1 VS Camera 2
Movement 2: Camera 1 VS Camera 2
Movement 3: Camera 1 VS Camera 2
I was looking a lot for the equal or unequal variances method but probably for my case I should use a paired-sample T-test, what do you think?
Dear Nuno,
If the emphasis is on the camera and the elbow is just a measurement instrument, then this is probably a two independent sample t test. You may also want to use ANOVA so as to combine the three tests into one.
Charles
Thanks for the suggestion but I think I will not need to combine the tests.
What I would like to know is, under the three cases of the independent sample t test, what should I use?
Besides I also heard about a Wilcoxon test as an alternative to the t-Student, but when should one use that?
Nuno,
Based on the limited information that i have about this situation, it seems like you want to use two independent sample t tests. If the variances are more or less equal, then you can use the equal variances version; otherwise the unequal variances version. If you are not sure, then I suggest that you use the unequal variances version since the results will be similar even if the variances are equal. I suggest that you take into account that the more tests you do the higher your type I error will be and so you should correct for this, as described on the webpage
Experimentwise Error
Charles
I believe I have found a computational error regarding how to determine the degrees of freedom. The section lists the formula utilized to ascertain the degrees of freedom by adding the two sample sizes together and then proceeding to subtract 2 from that total. However, it lists that 10 = 10 – 2 = 18. I believe this should be 10 + 10 – 2 = 18.
Benjamin,
Thanks for catching this typo. I have now corrected the error on the referenced webpage.
I appreciate your help in making the site more accurate and easier to understand.
Charles
it is very confusing regarding which t test should be use.
my topic is comparison between public bank and private bank.A sample of 100 from public and 100 from private means a total 200 sample size.
so plz suggest me which test can be appliede
It sounds like a two sample t test.
Charles
that i know
the confusion is equal variance or unequal variance
thanks
When in doubt, use the unequal variance test. If the variances are close to equal the results will be similar to the equal variance version.
Charles
thanks
I just wanna know if the formula for t-test foe mean is same as the formula for t-test for correlation coefficient? thanks
Vie,
They are not the same formula, but it turns out that there is a relationship between the two. See the following webpages for details:
Correlation in Relationship to t-test
T test for correlation
Charles
Hi Charles,
I want to ask which appropriate test will be used in this situation, I want to study the difference of the competency of criminology students in developing latent fingerprint using fingerprint powder and cyanoacrylate with the same respondents. I only selected 35 students,they used both powder and cyanoacrylate. Each of them has 8 different items to test their competency. I have already computed the mean of every items. Can you help me? I think paired t-test will be used because of the same tespondents.,or t test equal variance?
Since the same students are using each approach you need to use the paired t-test (provided the assumptions for the test are met).
Charles
Pls if a question is saying dat we av mean A as 700 and mean B as 695,, sample size A is 10 while sample size B is 15 … ….. . Sample variance A 40 and sample variance B is 40 as well. Which test statistics is applicable to solve dis question . is it t test or z test.. .. … . pls reply or yu can drop in my mail
Aderemi,
If your objective is to determine whether there is a significant difference between the population means for A and B, then you should use the t test (assuming the assumptions for the test are met). The results from the z test will generally be similar, but the t test is preferred.
Charles
Hi, I have a research on variation of CT number for one sample at 60 kVp and 120 kVp. Each kVp has 10 values. Which type of t-test should I perform? If I want to conduct my research for more kVp, can I still analyse the data using t-test? My last question, if 60 kVp data is normally distributed but 120 kVp data is not normally distributed which test should I proceed?
Many thanks in advance.
Wendy,
I don’t know what a CT number is, but in general if you are trying to compare two samples, you can use the t test. If you have more than two samples, you can use ANOVA.
If one of the samples is not normal, then you can still use these tests provided the data is not too far from normal, in fact the tests should work pretty well if the data is reasonably symmetric.
Charles
The research is performed on the same sample with different kVp, I want to compare the result of two different kVp, does it mean I need to use Two Paired Samples?
Wendy,
If you have a sample of n subjects and you measure two different kVp values for each subject in the sample, then you don’t have two independent samples (since the two values are derived from the same subject). In this case you need to use a paired sample test (e.g. the paired t test) and not the two independent sample t test.
Charles
Hi, I’m in need of some help.
I’m looking to test the difference between two datasets for solar panels. One of the datasets is the recorded output in kWh and the other is the modelled output I’ve calculated (in kWh). The datasets are 12 numbers, one for each monthly output. My issue is that the month of the year has a large effect on the output, so is it ok to do a T-Test? Or will I get results that aren’t related to one another but more the effect of the month of the year, as they correlate in its effect. I’d also like to know which T-Test I’d need to choose for this. Any help would be great thanks.
Dan
Dan,
Since you have time-series data, you need to account for potential autocorrelation and seasonality. A t test assumes that each sample is random, which won’t be the case when there is autocorrelation. Instead you may need to use other techniques. I am in the process of showing how to perform such analyses and hope to have this ready in a few weeks.
You could test for autocorrelation. If there isn’t a significant level of autocorrelation, you could use the standard t test. One such test for autocorrelation (restricted to first-order autocorrelation) is described on the webpage
Durbin-Watson Test
The following is a paper which shows how to modify a t test when there is autocorrelation. I have not read this paper, so I won’t comment further on it.
http://www.ncbi.nlm.nih.gov/pubmed/26011524
Charles
Hi, Charles
I came across one question which the standard deviations for two variables are 1.22 and 1.64 respectively. Also, the variances for these two are 1.49 and 2.70,
So which t-test should I use? equal variance or unequal variance?
Generally as long as one variance is not more than 3 or 4 times the other you can use the equal variance test. But when in doubt you should always use the unequal variance test, since if the variances are really equal then the two tests will yield almost the same result. In this case, I would expect the two tests to have very similar p-values.
Charles
Hi Charles, i have difficulty to distinguish the t test,
when should i use the two sample t-test and paired sample t-test,
Use the two sample t test with two independent samples (e.g. 50 school teachers and 45 students).
Use the paired sample t test with a sample of paired values where each member of the pair is not independent of the other member of the pair (e.g. 40 students with one score in the morning and the other score in the evening).
Charles
ttest result with my datas are like 2.38689E-05, what does it mean ??
The result is in scientific notation. 2.38689E-05 is the same as 2.38689 x 10^(-05), i.e. 0.0000238689, which is a very small number.
Charles
so, when the result of my t test is like 2.38689x 10^(-05), what should be the inference ? the null hypothesis may be rejected …right ? is the result statistically significant ?
This is a very small number, and so the null hypothesis may be rejected; the result is statistically significant.
Charles
Isn’t it that when the computed t value is smaller than the critical value, the remark should be not significant?
Jomar,
It depends on which one tail test you are referring to. For a left tail test, If t < t-crit (left) then you have a significant result, while for the right tail t > t-crit (right) yields a significant result.
Charles
want to know these things:
1. I am planning for one intervention :
I will be adminsterg pre-test to both expermtl grp and contrl group
then intervention- exptl grp
then post test to both exp and control group.
to check normality I will be performing independent t-test Pre-test of exptl and pre-test of control.
then again post-test of expl and post test of control I want to perform independent t-test.
also will be performing paired t-test on pre-test and post -test of exptal group.
similarly will be performing paired t-test on pre-test andpost -test of control group after intervention.
Also ANOVA after doing incase we get siginfincet difference in 1,2,and 3 varaibles
then want to go for t -test between 1 and 2
t-test betwee, 1 and 3
t test between 2 and 3 ………………..I will be using independent t-test am I correct
please guide.
Also I am confused what 2 use a. independent t -test for equal variances
b.independent t -test for unequal variances
can I use independent t -test for unequal variances in excel?
Regarding the follow up tests to ANOVA, you need to be careful about the experiment-wise error.You should read the Planned Comparisons and Unplanned Comparisons webpages.
Regrading t test for independent samples, you can always use the test for unequal variances. Even when the variances are equal the unequal variance test gives pretty good results.
Charles
Hello Sir,
I am also working on a similar problem as Amit.
However after drawing the histogram of the variables, it doesnt seem that the variables are normally distributed.
What should be done ?
Should I use Welch and unequal variances ?
Vernika,
The t test is pretty robust to violations of normality, and so usually I would just run the t test. If the data is quite different from normal, then I would use a non-parametric test — e.g. Wilcoxon signed-ranks test.
The situation is similar for ANOVA. If the data departs a lot from normality then you could use Kruskal-Wallis if the homogeneity of variances assumption holds.
Charles
Thankyou Sir.
My problem is only a post test analysis. I have the data for both the treatment and control group after intervention so is it possible that apart from the ttest, I get the results of my impact variables due to an intervention with the help of regression alaysis also creating a treatment dummy? Can I do such a regression by controlling other factors or I can just compare the means of the variable using the t test ?
Sorry Vernika, but I still don’t understand your question. E.g. I don’t know what you mean by “impact variables”, nor what it means for these variables to be “due to an intervention”, nor why you decided to use “regression analysis” or needed to create “a treatment dummy” (whatever that is).
Charles
I am trying to write my thesis on the comparison between patient and doctor of response to therapy in psoriatic arthritis. I am setting the doctor’s responses as the control and the overraters and underraters are being compared. I have set the doctor’s responses as control. How would I set up a T-test in excel? I already know it will be a 2 tailed t-test but am unsure the type I should do? For example what am I to enter into excel to get the deciding P-value?
I already have this in excel:
=TTEST(array1,array2,2,type?) what would type be according to my case?
If I could get some help as soon as possible that would be great thanks.
hello, this was really useful but could you please help me i do not know which type to use. i have two groups A and B and both groups did a PRE and POST test. the tests were the same in both groups
I am not sure which types you are referring to. Equal vs unequal variances? single sample vs two independent samples vs paired samples? Please explain.
Charles
hello sir
what is difference between equal variance and uneual variance in t-test
Hello Rajesh,
You use the equal variance version of the t test when the variances of the two samples are reasonably similar and you use the unequal variance version of the test when the variances are not similar. The good news is that you can always use the unequal variance version of the test since when the variances are almost equal the unequal variance version and the equal variance version of the t test produce pretty much the same result.
Charles
hi, good article! but i have a question: when using a two sample t test (independent), when should you assume equal variances?
To be on the safe side you can always use the unequal variances test. If the variances are close to equal the equal variances test will be quite similar to the unequal variances test.
Charles
Charles,
The t-stat number was negative at -5.97472 and I conducted a one tailed test so the P is 8.54E-07. I am not sure why the t-stat was negative. The MD was 10.7 between pre and post.
Charles,
I am in graduate school trying to write my research paper. I am struggling with the statistics I must include. I used a quasi experimental one group pretest posttest design. The pretest mean was 72.9 and the SD was 22.019. The posttest mean was 83.6 and the SD was 20.71. I am having trouble deciding which t-test to use? Do I use a one tailed t-test paired two sample for means?
Jessica
Jessica,
It sounds like you have one sample and got a measurement for each member of the group at two moments in time (pretest and posttest). If this correct, then you should use a paired samples t test (assuming the assumptions for a t test are satisfied).
Charles
Charles,
I read this on your website…Another approach is to take a sample of 20 people and have each person drink a glass of wine and take a memory test, and then have the same people drink a glass of beer and again take a memory test; finally we compare the results. This is the approach used with paired samples.
I am just confused by statistics in general. I guess my brain does not think that way.
I used an online calculator to do the one tailed t-test paired for two sample means and it gave me T value 1.899552, P value 0.031234 and result is significant at p<0.05. I do not understand what this means. Is there any way to put this in every day language?
Confused
Jessica,
A lot of people have trouble understanding the basic concept of hypothesis testing. It does take some getting used to.
In your example, you are trying to test whether the paired samples come from populations whose means are the same (or at least equal enough so that any difference may be due to random processes). The way the testing works is that you assume this (null) hypothesis is true (i.e. the two samples do come from populations with the same mean). The testing shows that (based on the null hypothesis being true) the probability that the sample data exhibit the obtained test statistic of 1.899552 is only 3.1234%, which is not so high. Since this probability is less than 5%, we are doubtful that the null hypothesis is really true, and so we reject this hypothesis and so conclude there is likely to be a significant difference between the means.
You can get more information on the webpage Hypothesis Testing.
Charles
I appreciate your help. The more I read, the more confused I seem to get. The figures I gave you were from an online calculator but when I put the numbers in Excel and did the t-test, I got different numbers with no explanation about if it is statistically significant or not.
Again, thank you for trying to help me.
Jessica
Charles,
Here I go again….
These are the results I got when I did a one tailed t-test paired: two sample for means.
What does this mean? Why is there a negative number when the posttest scores were higher than the pretest? Is this statistically significant or not?
t-Test: Paired Two Sample for Means
Variable 1 Variable 2
Mean 72.9 83.6
Variance 501.5413793 443.6965517
Observations 30 30
Pearson Correlation 0.899895057
Hypothesized Mean Difference 0
df 29
t Stat -5.974725464
P(T<=t) one-tail 8.54E-07
t Critical one-tail 1.699127027
P(T<=t) two-tail 1.70719E-06
t Critical two-tail 2.045229642
I hope you can clarify this for me.
Jessica,
A p-value less than .05 is usually considered to be statistically significant. For the two-tailed test you show a value of 1.70719E-06. This equivalent to the decimal number .00000170719, which is clearly less than .05. This statistically significant.
I don’t see any negative number, unless you are referring to the exponent in 1.70719E-06. This not a negative number. A negative exponent just moves the decimal point to the right (as described above).
Charles
Dear Charles,
Could you help to interpret the below result from pairs sample t-test for a group of inspector before & after applied kappa statistic:
. # of inspectors: 23
t-Test: Paired Two Sample for Means
Variable 1 Variable 2
Mean 0.002449451 0.001223162
Variance 6.37156E-06 8.40796E-07
Observations 23 23
Pearson Correlation 0.252600165
Hypothesized Mean Difference 0
df 22
t Stat 2.392373093
P(T<=t) one-tail 0.012857038
t Critical one-tail 1.717144374
P(T<=t) two-tail 0.025714076
t Critical two-tail 2.073873068
The result showed that, p value = 0.025<0.05, so we reject the null hypothesis.
It means that, there is a significant mean different between two period of times (before and after applied kappa) ?
Please help to advise me to fully interpret the result.
Best regards,
Vu Nguyen
Yes, if p value = 0.025<0.05, you would reject the null hypothesis, which means that there is a significant mean different between two period of times (before and after).
Charles
Hi,
can you give a formula of T-Test for related measures if the S as X and S1 as Y?? Cause i don’t really understand about this. I’m a student of university and i have a subject about apply statistic.
Sorry, but I don’t understand your question.
Charles
Hi
I am taking a survey on expected and percieved service levels and then conduct a t test, to know the difference is significant or not. So the participants have to be different for expected and percieved? and do i have to assume equal variance or unequal variance
Thank you
You can create two samples with different participants. If the sample variances are quite similar then you can use the equal variance test. Otherwise you should use the unequal variance test.
It is likely (depending on the exact nature of the surveys) that you can create one sample and test expected and perceived service levels with all the participants in the single sample. In this case you would use the paired t test.
Charles
Thank you very much
Hi,
I have 2 different samples from 2 different states. I want to perform a statistical test to detect p-value. In case of comparing the same disease results of two different samples,which test we can use?
If the assumptions for the t test are satisfied you can use the two sample t test. If the variances of the two samples are similar then you can use the t sample t test with equal variances. This test is pretty forgiving about what “similar” means. E.g. generally even if one sample has variance 4 and the other has variance 8, the equal variances test will usually work quite well. If the variances are very different (say one has variance 4 and the other has variance 40) then you should use the two sample t test with unequal variances. When in doubt use the two sample t test with unequal variances.
Charles
Can I use t test if the actual distribution not normal?
Ken,
The t test assumes that the data is normal, but it is pretty forgiving of violations of normality. The test should work quite well unless the data is very skewed, in which case the Mann-Whitney test may be a better solution.
Charles
I just want to make sure that I am doing this correctly.
N1 126 Salaries for mlb team that gained a playoff spot btwn 2000 and 2014
N2 324 Salaries for mlb team that didnt gain a spot.
compared the means using t test non paired gave me statistically differente
I assumed that variances were equal Ftest 1.54 prob 0.999
can you correct me if i´m wrong
George Szmn,
Unless for some strange reason the two samples are highly skewed (not likely to be a problem), the approach you used looks correct.
Charles
Hello
How can i prove that the p-value of 2 sample t-test with equal variance is the same as the p-value of a one-way Anova with 2 samples?
Thank you
Melody,
I have not tried to do this, but I wouldn’t be surprised if you needed to use the fact that F.DIST(x,df,1,TRUE) = T.DIST(x,df,TRUE)^2; i.e. Property 1 of the webpage https://real-statistics.com/chi-square-and-f-distributions/f-distribution/.
Charles
Hi,
I am trying to find out if there is a significant improvement between a groups mental wellbeing scores at 2 different points of time (ie. before intervention and after intervention).
Rather than having each individuals score to use for calculations, I have the mean score for each question on the questionnaire before intervention and the mean score after intervention.
For example my data table looks like this
Question Average Initial Score Average Final Score
Feeling useful 2.5 4.6
Feeling relaxed 2.5 4.6
Feeling loved 2.5 4.6
Feeling cheerful 2.5 4.6
Using excel, would I use a t-test, two tailed, and type 1?
Rebecca,
You should use the detailed data not the sums or average scores (since you also need to know the sample sizes and variances). This will be a paired samples (aka repeated measures) t test (which if I remember correctly is type 1). Generally you would use a 2 tailed test (unless you are very confident that the scores won’t go down after intervention).
Charles
Hi
Are you still able to perform a Ttest when there are different numbers of participants for each component?
Thanks
Jess,
You can perform a two sample t test even if the samples have a different number of elements.
Charles
Perfect thanks for you help!
I also have another question. I want to perform a t test for means, I have a sample (with a mean and variance) and a reference value. The classic formula for the t statistic uses means and variances. I know how to compare it by using the t test formula. But what if my reference value has a standard deviation? Do I use the formula and assume my reference is a sample too and use n = 1 for my “reference sample”? For example, I have a sample with mean 3,4 and variance 1,2, and I want to compare it to a reference value of 3, and I assume that my reference value has a variance of 2…
I don’t completely understand your question, especially since I don’t know what you mean by “reference value”. Based on how you describe the problem, the approach you suggest might be appropriate, although it is more likely that you need to use a sample size for the second “sample” equal to the sample size of the first sample.
Charles
Ok, for example : I have a distribution of 50 temperatures, with the mean and standard deviation. Then, I want to compare it with a reference value. For example, in that time of the day, in a particuliar place the real temperature should be 20 degrees, with a standard deviation of ± 5 degrees. This reference value is not a distribution, I only have one value. In the formula, the result depends on n, but if I take n = 1 for the reference, the test will be very easy to pass, on the other side if I take n = 50 for both, its not really true beceause I only have one value for the reference…
As you can see from Theorem 1 of the referenced webpage, for each sample you need to know the sample mean, sample variance and sample size of each sample to conduct a t test. Without this information, you won’t be able to conduct the test.
Charles
Hi, I have a specific problem. I have 2 different distributions (samples) i.e. in measure in 2 different conditions. I want to perform a statistical test to detect a mean difference of at least 5 between the 2 samples. My H0 hypothesis is : M1 – M2 = 5, my H1 hypothesis is M1-M2 < 5 (because I want to prove that the difference between the 2 means is less than 5 units). How can I do that with Excel?
You can use Excel’s t test data analysis tool as described on the referenced webpage. Insert 5 in the Hypothesized Mean Difference field and look at the one tail results.
Charles
Ok, I cant have directly the p value or statistic of that in one excel cell (I want the excel sheet to be already ready and I just plug the data)?
If I understand correctly, you want to conduct a one-tailed two independent sample t test. In Excel this can be done using the Two-Sample Assuming Equal Variances data analysis tool. Click on the Data ribbon and choose the Data Analysis tab. Select Two-Sample Assuming Equal Variances data analysis tool (assuming the variance are similar; otherwise choose the Two-Sample Assuming Unequal Variances data analysis tool). Fill in the dialog box with the input ranges and fill in the Hypothesized Mean Difference field with the value 5.
Charles
Hello. Can anybody help me with my problem? I have a research and initially had 3 treatments, so I proposed ANOVA as my statistical tool in determining the significant difference. But along the experiment it happened that one of the 3 treatments did not respond to my procedure. So, my results have only 2 treatments to determine the difference. Is it applicable to shift to T-test instead of ANOVA since I only have to get the significant difference of two treatments because the third treatment has no variance?
Yes you would use a t-test. You could use ANOVA, but in this case you would not include the treatment with no results. The results will be the same as for the t test, but the t test is probably easier to calculate and interpret. When you report your results, you should explain that you had planned to analyze three treatments and explain why you got no data for this treatment.
Charles
I typed a comment last evening asking for help trying to decide how to handle a statistics problem. I need to form a hypothesis where two groups of students at a Private Catholic School one group who lives in North Bethesda (120 observations) are said to receive higher grades on the SATs. Those students living in South Bethesda (132 observations) received lower test scores on the SAT. Sample mean is 86 and 87 respectively with 8.1 and 7.3 populations variances and an .01 level of significance. Is there evidence that students living in South Bethesda may be getting lower grades on the SATs?
Kennedy,
I sent a response yesterday. I am resending it below:
Since you have the population variances you can use a two sample test using the normal distribution, as described in Theorem 1 of Comparing Two Means.
The null hypothesis is mean1 >= mean2 (these are population means). The test statistic is z = (m1-m2)/stdev, where m1-m2 = 88-87 = 1 (sample means) and stdev = sqrt(var) where var = v1^2/n1 + v2^2/n2 = 6.2^2/132 + 7.0^2/125. If NORMSDIST(z) > .99 then you reject the hypothesis that the the workers receive the same pay. This is a one tailed test. If you want a two-tailed test you need to replace .99 by .995.
If instead of the population variance you had the sample variances you would use Theorem 1 of Two Sample t Test instead.
Charles
What do you do if the number of cases are not equal? How would you calculate the df then?
The formulas and functions on the referenced webpage don’t require that the number of cases be the same. Just use the formulas and functions shown on the webpage.
Charles
Hi Charles,
In the first example, can I know the meanings of data entered in Old and New columns?
For example, does the greater the number explain the greater the enjoyment?
What scale could be used?
Clarification could be helpful.
Thank you in advance for the post and the answer as well.
Presumably the higher the score the more enjoyable the beverage (although for the t test it really doesn’t matter whether a higher score represents more or less enjoyment). Scale also really doesn’t matter, but let’s assume that each point represents the more enjoyment option in a series of True/False questions.
Charles
a number of samples 170, in 2012 mean 12366 std dev 3891 and in year 2011 mean 12549 std dev 4232 . corelation-coeff .92879. Can it be concluded that the value of stock holding decreased? how to solve this problem using excel? i mean i am facing trouble to determine std err
You are referencing the webpae regarding two sample t-test with independent samples, but the correlation coeffcient of .92879 shows that these samples are not likely to be independent. Perhaps you are trying to run a two paired samples test — e.g. where the stock holdings are in say 170 different factories, comparing 2011 with 2012. In this case you might be able to use the fact that var(x-y) = var(x) + var(y) – cov(x, y) and cov(x,y) = corr(x,y) * sqrt(var(x))*sqrt(var(y)). This is the best I can do with the information you have provided. I hope that it is helpful.
Charles
Assuming I have 2 treatments and three trials per treatment. How should I solve the statistical problem of this?
Noemi,
Are you saying that you have two treatments and a sample of 3 for each treatment? You aren’t going to do much with such a small sample, but it is probably best to use the Mann-Whitney test instead of a t-test in this case.
Charles
Dear Charles
First , many thanks for sharing such valuable knowledge . I have a question regarding this page . In example 1 , while I understand that the null hypotheis is rejected because of P value of tow-tail is lower than 0.05, I can not understand this sentence that you have added at the end of example :”In fact, the new flavoring is significantly more enjoyable.” I do not know how should I recognize whether the dependent variable in sample one is increased or decreased significantly compared to the sample 2. All my appreciation for any advice as I am stucked in it
Dear Marzieh,
Before you collect data and conduct the test you don’t know whether the mean of the sample will be in the right tail, left tail or neither. After the test you have evidence as to whether or not the sample mean is in one of the tails and if so which tail. It is on this basis that I drew a conclusion. Of course this conclusion won’t always be correct, but the evidence points in the direction indicated.
Charles
I am using a t test to compare before and after weights using a diet. n=78. In excel, I am not sure whether to use 1, 2, or 3, under type in the formula box. Can you explain clearly the differences? Thanks.
Jo,
You use type = 1 when the two samples are not independent. E.g. (1) when the first sample contains men and the second contains their wives or, as in your case (2) the first sample contains each person’s weight before dieting while the second sample contains their weight after dieting. In example (2) the same person is being sampled and so the samples can’t be independent.
Type 2 and 3 are used when the two samples are independent. E.g. 20 people are selected at random and half are randomly put in group 1 and half are randomly put in group 2. The difference between type 2 and type 3 relates to the variances of the populations from which the samples are drawn. If the variances are equal then use type = 2, while if the variances are unequal use type = 3. In reality the variance don’t have to be identical to use type = 2. Even if they are close you will usually get good results You usually judge two populations to have equal variances if the two samples have variance that are not too different; in fact even if one sample has a variance which is 4 times the other, the results will be pretty good even if you use type = 2.
For your situation, it looks like you want to use type = 1.
Charles
Hi Charles,
I need some help. I have two sets or raw date (sample size around 80 for each sets, although not equal in numbers). My hypothesis is “If untreated enzyme (Data 1) is any difference to treated enzyme (Data 2)”.
I have not plotted any graphs or anything yet. How do I go about managing the excel with the data I have?
Arfay,
Assuming that the data sets are for different subjects and that the test assumptions are met, you use the two sample t test as described on the referenced webpage.
Charles