Property 1: Let x̄ and ȳ be the sample means of two sets of data of size nx and ny respectively. If x and y are normal, or nx and ny are sufficiently large for the Central Limit Theorem to hold, and x and y have the same variance, then the random variable
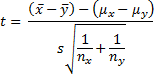
has distribution T(nx + ny – 2) where
![]()
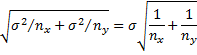
Proof: Let σ be the common standard deviation of x and y. Then x̄ – ȳ has a normal distribution with mean µx – µy and standard deviation
Defining z as follows, we know that z has distribution N(0, 1).

We also know that  s_x^2/\sigma^2")
 s_y^2/\sigma^2")
![]()
has distribution χ2(nx + ny – 2).
Defining t = z
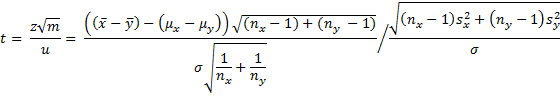

where s is defined as in the statement of the property.
Reference
Soch, J. (2021) Proof: Two-sample t-test for independent observations. The Book of Statistical Proofs
https://statproofbook.github.io/P/ug-ttest2
nice!
Dear Charles,
Is there any way to do t-test when the variance of one sample is unknown?
I want to compare the mean of my sample (collected in 2020) with the mean in another sample (from the same population, i.e. country) twenty years back by another colleague who hasn’t reported the variance in their paper.
I appreciate your advice.
Regards,
Ali
Ali,
You need the variance to perform a two-sample t-test. You could perform a one-sample t-test against the mean of the sample whose variance you are missing. This would work provided that the mean of this sample (i.e. the sample whose variance you don’t have) is a good estimate of the population mean. Not great, but it may be all that you have.
Charles
you missed a square at this u
http://i0.wp.com/www.real-statistics.com/wp-content/uploads/2013/03/image3398.png
Thank you for catching this error. I have now corrected the mistake.
I appreciate your helping to make the website more accurate and easy to follow.
Charles
thank you very much sir for this informations.
Hi Charls,
Can u guide me : On interpreting the p value score and result for both hypothesis and that too for same case
Way1 : H0 = there is no change in awareness level of TG
Ha = there is significant change in awareness level of TG
Way2 : H0 = Awareness level has increased among TG post campaign
Ha = There is no change in awareness level How 2 Null hypothesis for same case
Can u plz suggest how two different hypothesis for same case can make change in result and interpretation. Please suggest
Hello,
It sounds like Way1 will require a two-tailed test (in Ha, awareness can increase or decrease), while Way2 requires a one-tailed test (you seem to be ruling out the case where aware decreases).
Charles