Cohen’s d Effect Size
We can calculate Cohen effect size d, as in One Sample t Test, by:
![]()
This is approximated by
![]()
When the population variances are assumed to be equal, then an estimate of the pooled variance is given by
![]()
Example 1: Find the effect size for the study in Example 2 of Two-Sample t-Test with Equal Variances.
![]() Here, the pooled variance is
Here, the pooled variance is
![]()
This means that the control group has a driving score 4.1% of a standard deviation more than the group that is taking the hay fever medication. This is generally considered to be a very small effect.
Hedges’s g Effect Size
As we saw in the one-sample case (see One Sample t Test), this effect size statistic is biased, especially for small samples (n < 20). An unbiased estimator of the population effect size is given by Hedges’s effect size g.
![]()
where df = n1 + n2 – 2, m = df/2 and Γ(m) is the gamma function at m.
Interpretation
The default interpretation of Cohen’s d effect size is
- .20: small effect
- .50: medium effect
- .80: large effect
Confidence Interval
We show how to calculate a confidence interval for Cohen’s d from a two-sample t-test, using an approach from Hedges and Olkin (1985). The 1–α confidence interval is
d ± se · zcrit
where zcrit = NORM.S.INV(1-α/2) and
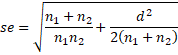
This approximation is valid for large samples. Here n1 + n2 in the second term can be replaced by df, which should not matter much with large samples.
For Example 1 of Two-Sample t-Test with Equal Variances, we see in Figure 1 that Cohen’s d = .96212, Hedges’ g = .923635, and the 95% confidence interval for d is (.057667, 1.866573).
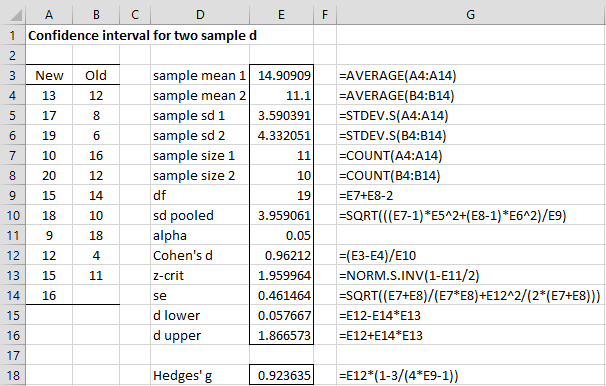
Figure 1 – 95% confidence interval for Cohen’s d
Worksheet Functions
Real Statistics Functions: The Real Statistics Resource Pack provides the following array functions.
T_EFFECT2(m1, m2, s1, s2, n1, n2, lab, alpha, 0) = column array with the values Cohen’s d, Hedges’ g, and the lower and upper confidence interval limits for d and g based on a two independent sample t-test for sample 1 with mean m1, standard deviation s1 and sample size n1, and sample 2 with mean m2, standard deviation s2 and sample size n2.
TT_EFFECT2(R1, R2, lab, alpha, 0) = T_EFFECT(m1, m2, s1, s2, n1, n2, lab, alpha, 0) where m1 = AVERAGE(R1), s1 = STEV.S(R1), n1 = COUNT(R1), m2 = AVERAGE(R2), s2 = STEV.S(R2) and n2 = COUNT(R2).
alpha is the significance level (default .05). If lab = TRUE (default FALSE) then an extra column of labels is appended to the output.
Note that the last argument in these functions is 0, in which case the Hedges and Olkin confidence interval is returned. If this last argument is a positive integer (default), then the confidence interval is based on the noncentrality parameter, as defined in Confidence Intervals for Effect Size and Power.
Referring to Figure 1, we see that the array formulas =T_EFFECT2(14.909, 11.1, 3.590, 4.332, 11, 10, TRUE, .05, 0) and =TT_EFFECT2(A4:A14, B4:B14, TRUE, .05, 0) result in the output shown in Figure 2.
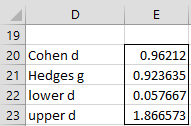
Figure 2 – Effect size and confidence interval
Actually, the output consists of two more rows with the lower g and upper g.
r-Effect Size
In Dichotomous Variables and the t-test, we describe another measure of effect size, namely the r effect size (aka η or φ), and describe the relationship between r and Cohen’s d. Often r2 (aka η2) is used as the effect size measurement instead of r.
In brief, r can be viewed as a correlation coefficient. Furthermore, r2 represents the percentage of the total variance explained by the treatment. It is calculated by

r = .1 represents a small effect, r = .3 represents a medium effect, and r = .5 represents a large effect. The equivalent values for r2 are .01, .09, and .25.
Effect Size when Variances are not Equal
Click here to learn more about effect size for two samples with unequal variances.
Examples Workbook
Click here to download the Excel workbook with the examples described on this webpage.
References
Hedges, L. V. and Olkin, I. (1985) Statistical methods for meta-analysis. Academic Press
https://www.researchgate.net/publication/216811655_Statistical_Methods_in_Meta-Analysis
SAGE Publications (2019) t-tests: one-sample, two-independent-sample, and related-samples design.
https://us.sagepub.com/sites/default/files/upm-assets/98047_book_item_98047.pdf
Lakens, D. (2013) Calculating and reporting effect sizes to facilitate cumulative science: a practical primer for t-tests and ANOVAs. Frontiers in Psychology.
https://www.frontiersin.org/articles/10.3389/fpsyg.2013.00863/full
Ellis, P. D. (2010) The essential guide to effect size. Cambridge University Press.
https://books.google.it/books/about/The_Essential_Guide_to_Effect_Sizes.html?id=5obZnfK5pbsC&redir_esc=y
Howell, D. C. (2010) Confidence intervals on effect size
https://www.uvm.edu/~statdhtx/methods8/Supplements/MISC/Confidence%20Intervals%20on%20Effect%20Size.pdf