Jackknifing
We can use a procedure called jackknifing to create a 1–α confidence interval for the population Gini coefficient. In this procedure, G = the Gini coefficient for the sample, and we define the Gini coefficient Gi that results from the sample where ith sample element is deleted. The jackknifed estimate of the population Gini coefficient is defined by
![]()
The standard error for G* can be estimated as
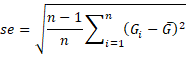
where G-bar is the average of the Gi values; i.e.
![]()
Bootstrapping
Alternatively, we can use the bootstrap method described in Resampling. This is accomplished by drawing k subsamples of size n with replacement from the original sample. For each subsample, we calculate the Gini coefficient Gj. We can use the following estimator of the standard error for G.

where G-bar is the average of the k Gj values; i.e.
![]()
A 1–α confidence interval is given by (G’α/2, G‘1-α/2) where G‘m is the mth smallest element among the k bootstrap elements.
Bias-corrected Confidence Interval
There is also a bias-corrected confidence interval defined as (G’p, G’q), where
p = NORM.S.DIST(2z0–z1, TRUE)
q = NORM.S.DIST(2z0+z1, TRUE)
and
z0 = NORM.S.INV(r)
z1 = NORM.S.INV(1–α/2)
r = the fraction of Gj bootstrap values that are less than or equal to G
Worksheet Functions
Real Statistics Functions: The following array functions are provided in the Real Statistics Pack:
GiniTest(R1, lab, iter, alpha): outputs a 5 × 1 column range containing the Gini coefficient for the data in R1, the mean Gini coefficient from the bootstrapping with iter bootstraps, the standard error, and the lower and upper ends of the 1–alpha confidence interval.
GiniUnbiased(R1, lab, iter, alpha): outputs a 7 × 1 column range containing the Gini coefficient for the data in R1, the mean Gini coefficient from the bootstrapping with iter bootstraps, the standard error, the lower and upper p-values (i.e. p and q as defined above) and the lower and upper the ends of the confidence interval described by p and q.
If lab = TRUE (default is FALSE), then an extra column of labels is added to the output. alpha defaults to .05, and iter defaults to 2000.
For Example 1 of Lorenz Curve, =GiniTest(A4:A23,TRUE) yields the results shown on the left side of Figure 1, and =GiniUnbiased(A4:A23,TRUE) produces the results shown on the right side of the figure.
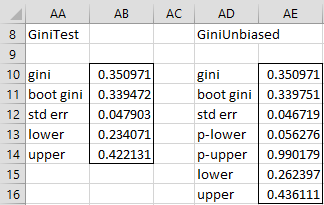
Figure 1 – Gini confidence intervals
Examples Workbook
Click here to download the Excel workbook with the examples described on this webpage.
Links
References
Mirzaei, S., Borzadaran G. R. M., Aminib, M., Jabbarib, H. (2017) A comparative study of the Gini coefficient estimators based on the regression approach. Communications for Statistical Applications and Methods. Vol. 24, No. 4, 339–351.
http://www.csam.or.kr/journal/download_pdf.php?doi=10.5351/CSAM.2017.24.4.339
Buchan, I. E. (2016) Gini coefficient of inequality. Stats Direct Limited
https://www.statsdirect.com/help/nonparametric_methods/gini.htm