Basic Concepts
Another measure of diversity is based on the probability that any two elements selected at random will belong to the same category, i.e.

where ni is the number of observations from the sample in the ith of k (non-empty) categories, n is the sample size, and pi = ni/n.
Since diversity corresponds to a low value of D and lack of diversity corresponds to a high value, it is better to use 1 – D, which is called Simpson’s index of diversity. This index takes values between 0 and 1.
Another measure is Simpson’s reciprocal index of diversity, which is defined as 1/D. This index takes values between 1 and k.
The above approach assumes sampling with replacement. For small samples, it is better to use sampling without replacement, in which case D is defined as
![]()
Note that it is common to study the measure 1 – D′ or 1/D′.
Example
Example 1: Repeat Example 1 of Shannon’s Diversity Index using Simpson’s index of diversity.
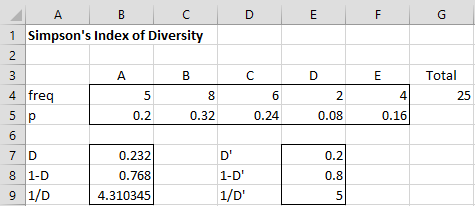
Figure 1 – Simpson’s Diversity Index
Figure 1 shows the D and 1/D indices. Cell B7 contains the formula =SUMSQ(B5:F5) and cell E7 contains the formula =SUMPRODUCT(B4:F4,B4:F4-1)/(G4*(G4-1)).
Note that for a large population, the maximum value of D is 1/k, and so the maximum value of 1/D is k. Thus, we can use (1/D)/k = 1/Dk as an index of homogeneity.
Links
Examples Workbook
Click here to download the Excel workbook with the examples described on this webpage.
References
Offwell Woodland & Wildlife Trust (2016) Simpson’s diversity index. Ecological sampling methods
http://www.countrysideinfo.co.uk/simpsons.htm
Wikipedia (2016) Diversity index
https://en.wikipedia.org/wiki/Diversity_index
Hi Charles,
Thanks for the free package and this website which is really helpful for learning how to do diversity indices on excel!
I have followed the instructions on this webpage and have results for the diversity indices. However, I noticed that on the example above, there is a row that has p (on the example it is cell A5). I was wondering what this was, and if I were to utilize this, how would I do this on excel with the package?
I have one more question. The output for the Simpson’s diversity index also has another column titled “Sm Sample”. I was wondering what the data in this column was?
Thanks,
S. A.
Sabre,
Row 5 contains the probabilities corresponding to the frequencies in row 4. E.g. cell B5 contains the formula =B4/$G4.
Sm Sample stands for the small sample version of Simpson’s index. This is described on the Simpson’s Index webpage.
Charles
How would you best proceed when you need the Simpson Index applied to hundreds of various locations in order to compare variability between location? Is excel capable of processing that or is a stat software the only possibility? Thanks
I don’t know of any reason why you couldn’t use Excel even for hundreds of locations.
Charles
How would you calculate confidence intervals so error bars can be included in a graph?
Hello Andrew,
Probably the approach described on the following webpage will be useful:
https://real-statistics.com/excel-capabilities/chart-standard-errors/
Charle
emm type 2 N(No) N(Yes)
28 90 57
89 80 61
1 77 60
4 41 34
12 36 28
3 20 20
6 17 20
77 21 14
44 11 23
83 13 7
75 20 27
66 1 13
87 9 17
2 9 5
11 3 5
81 7 1
86 1 5
63 3 2
108 0 5
82 3 2
9 2 2
22 2 2
88 4 0
92 2 2
102 2 2
5 1 2
53 0 3
58 1 2
76 1 2
95 1 2
100 0 3
118 1 2
169 1 2
8 2 0
49 0 2
73 1 2
80 1 1
94 1 1
110 0 2
103 0 2
13 0 1
25 1 0
29 0 1
32 0 1
42 1 0
48 0 1
54 0 1
60 0 1
65 1 0
68 0 1
85 1 0
72 1 0
90 0 1
104 0 1
105 0 1
112 0 1
116 0 1
121 1 0
180 0 1
230 0 1
183 0 1
What is your question or comment?
Charles