Basic Concepts
For categorical data, there is no mean or median, and so we can’t use the measures of variation described in Measures of Variability. Instead, we use a measure of the distribution of observations among the categories. In particular, for a random sample, we can use Shannon’s index of diversity (aka as Shannon-Weiner’s index), which is defined as
Here, ni is the number of observations from the sample in the ith of k (non-empty) categories and so n = 
where pi is the proportion of observations in the ith of k (non-empty) categories. We usually use e, 10, or 2 as the base of the logarithm.
The maximum value of H′ occurs when all the categories have the same number of observations, in which case all the pi are equal. Since the sum of the pi is 1, it follows that
![]()
Thus
which proves that![]()
It is common to consider the following measure of relative diversity (aka evenness or homogeneity):
![]()
We can view 1 – J′ as a measure of heterogeneity (or dominance).
Another measure of homogeneity is given by the formula
![]()
Interpretation
As observed above, H′ is largest occurs when all the categories have the same number of observations (homogeneity of categories), in which case all the pi are equal. In this case, J′ = 1. J′ takes values between 0 and 1. When J′ = 0 the categories are most heterogeneous.
Examples
Example 1: Find Shannon’s index of diversity and index of relative diversity for a random sample of 25 observations distributed among five categories as shown in range B4:F4 of Figure 1.
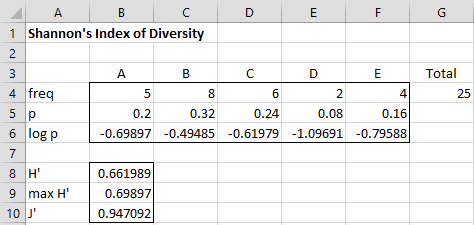
Figure 1 – Sample Index of Diversity
The result is shown in Figure 1.
Here, cell G4 contains the formula =SUM(B4:F4). Cell B5 contains the formula =B4/G4. Cell B6 contains the worksheet formula =LOG10(B5). B8 contains the formula =-SUMPRODUCT(B5:F5,B6:F6). Cell B9 contains the formula =LOG10(COUNTA(B3:F3)) and, finally, cell B10 contains B8/B9.
Alternatively, H′ in cell B8 can be calculated by the formula
=LOG10(SUM(B4:F4))-SUMPRODUCT(B4:F4,LOG10(B4:F4))/SUM(B4:F4)
The sample value of H′ tends to underestimate the corresponding population index of diversity H (i.e. it is a biased estimate). Note that some categories from the population may not be present in a sample (especially in a small sample). Thus, the sample value of J’ tends to overestimate the corresponding population relative diversity index J′. This means that it is a biased estimate.
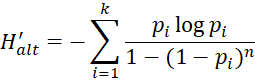
Improved Version
The following is an improved version of Shannon’s index which takes into account that some population categories may not be present in the random sample.
Links
Examples Workbook
Click here to download the Excel workbook with the examples described on this webpage.
References
Offwell Woodland & Wildlife Trust (2016) Simpson’s diversity index. Ecological sampling methods
http://www.countrysideinfo.co.uk/simpsons.htm
Krebs, C. J. (2014) Species diversity measures
https://www.zoology.ubc.ca/~krebs/downloads/krebs_chapter_13_2017.pdf
Wikipedia (2016) Diversity index
https://en.wikipedia.org/wiki/
NIST (2016) Shannon’s diversity index
https://www.itl.nist.gov/div898/software/dataplot/refman2/auxillar/shannon.htm
can we use herbaceous biomas for Shannona diversity index calculation ?
I am not an expert on herbaceous biomass, but I saw quite a few articles when I googled “herbaceous-biomass and shannon’s diversity”.
Yes, it appears that you can use Shannon’s diversity index for herbaceous biomass.
Charles
Yes you can
Hi there,
Can I utilize the Shannon diversity index if I replace species count with percentage coverage? If yes, how should I proceed in this case? and if not , what formula should i use to analyze the data ? Thank you so much for the help.
Regards
Frances lam
Hi Frances,
Does percentage coverage correspond to row 6 in Example 1? If so, then example shows how to proceed. If not, what is the difference between percentage coverage and row 6?
Charles
Hi Charles:
Thanks for this guide on this index, it really helps a lot!
But I have encountered a little problem when practicing this process. How should I deal with the 0 values? As LOG can’t calculate this?
Hello Yi Xu,
As you have noted, for this index none of the categories can be zero. You can either not include empty categories or use a different diversity index.
Charles
How do you interpret the H’ value of 2.35, 2.02 and 2.48? Thank you.
After calculating the H’ value, how do you interpret the data? Is the range value and corresponding interpretation for that? Thank youu.
Hello Sheena,
I have just added an Interpretation section to this webpage that should answer your question.
Charles
Good afternoon Charles.
Thank you for the information on Shannon-Weiner diversity index: it’s awesome.
But, please how do I present the alternative formula in excel?
Thanks.
Archibald
Seems like there’s another typo. The text says “cell B5 contains the formula =A4/G4,” but I think the formula in B5 should be =B4/G4…and I’d use =B4/$G$4 so I could fill right with it.
Paul,
Yes, you are correct. Thanks for finding the typo and improving the website. I have just corrected the webpage.
Charles
There’s a slight typo. To get the Max H’ it should be LOG10(COUNTA(B4:F4)).
Christopher,
COUNTA(B4:F4) and COUNTA(B3:F3) should have the same values, namely 5.
Charles
Hi Charles, how do you calculate standard deviation for H’? I am comparing H’ for two sites and am unsure which graph type to use and how to calculate SD for a single H’ value. Thanks, Alex
Alex,
See https://www.statsdirect.com/help/nonparametric_methods/diversity.htm
Charles
Fantastic help! Thanks so much!!!!!!!!
Hi Charles,
Thank you for the article, it was very helpful. But I have one question and I haven’t been able to find the answer, probably because depends on the situation.
My question is, what is the minimum sample size to use Shannon’s Diversity Index and obtain reliable results? I sampled 13 different sites/points and found 11 different species and a total of 110 individuals.
Do you think that this sample size is enough?
Thank you,
Daniel Santos
Daniel,
You can calculate the index with any sample size.
Charles
Good afternoon Charles,
Hope all is well. I just have a simple question. If my data from a small sample has only one species, then my Shannon Weiner is one. How do I include this point on a bar graph?
Best,
Theresa
Theresa,
Sorry, but I don’t understand your question. What bar graph are you referring to?
Charles
I was given two formulas of Shannon’s diversity index.
a. H’ = – ∑ pi ln pi
b. H’ = [N*log(N) – ∑ni log (ni)]/N
For the same data, I used both of the formulas given and the results are different. I wonder where I went wrong.
Hello Vivi,
I don’t know what N*represents. In any case, on this webpage there are two formulas given which should yield the same result *on involving the n_i and the other involving the p_i).
Charles
Dear Charles
Can you guide me? How can I use the Shannon Diversity Index?
Dear Guma,
Specifically what do you want to use Shannon’s Diversity Index for?
Charles
Hello, Dear Charles, I want to ask I have data of population for every 3 cities and GDP of these cities and urban area. Can I use for correlation or validation with Shannons diversity index ..
Hello, Dear Charles. I want to ask, can I use for Shannon Diversity Index data of population every 3 cities and GDP and I have data for the (ha)of the urban area.
Hello Guma,
Probably yes, but it depends on how you use the index.
Charles
Hello, first of all
Thank you for your post it was very helpfull, but i encountered a little problem.
My Shannon’s diversity index is superior to my H’max with Ln but also log2 or log10.
I was wondering if you had an idea
Best Regards
Hello Benjamin,
Sorry, but I have not understood the issue that you are raising.
Charles
Hello, thank you for your quick answer.
My issue is my H’ value is 7,054 and my H’max 4,392 for 21 species so it’s impossible. But i applied the formula : -Sum of (pi log2 pi) so i don’t understand where can my mistake could be
If you email me an Excel file with your data and calculations I will try to figure out what has gone wrong.
Charles
Hello,
I wanted to ask when calculating Shannon’s index, do we use number of the species or abundance number?
Thank you
Hello Monika,
You haven’t given me enough information to give a definitive answer, but you probably need to use the frequencies (abundance numbers?) of each species.
Charles
Hi Charles,
What is the ‘p’ variable in the second definition of the Shannon index that you defined?
Also do you have a reference for this that i could read up?
Thanks
Hello David,
p_i = n_i / n
See Zar’s textbook, as described in the Bibliography, for more details.
Charles
Hi Charles,
Sorry, I meant the last definition where you have both a p and a p_i
Thanks
Hello David,
All the references to p should be p_i.
Charles
Shannon’s diversity index uses the natural log of pi not log base 10.
Hello Andrew,
Perhaps I am mistaken, but I understood that log base 2, 10 or e could be used. I think I saw this in Zar’s textbook.
Charles
What do I do if I have “zero” in a certain category?
KB,
Generally you should omit that category since log 0 is undefined.
Charles
When calculating Shannon’s index, how do you standardize by the number of quadrats sampled when unequal sample unit size occurs among sites? Using cover data for vegetation.
Mary,
Perhaps I don’t understand your question, but Shannon’s index doesn’t assume that numbers need to be equal.
Charles
Hi Mary,
I guess I am doing similar thing as you do. I try to use land cover ctaegories and compare H’ in different counties. Counties obviously have different areas and I wonder how this would (or maybe not) change my calculations. From Charles answer to you it seems that differences in areas are irrelevant. Do you agree? Thanks!