Data Analysis Tool
Real Statistics Data Analysis Tool: The Real Statistics Resource Pack supplies the ROC Curve and Classification Table data analysis tool, which provides an easier way to construct the ROC curve and classification table. We show how this is done for Example 1 of Classification Table and ROC Curve.
The tool accepts either of two input formats: one with two columns (e.g. B24:C34 of Figure 1 of Classification Table) and another with three columns, which we illustrate in Figure 1.
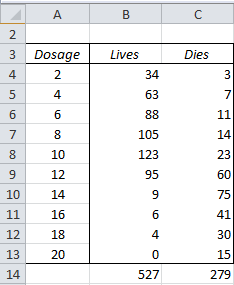
Figure 1 – Data input for ROC (three-column format)
The format is similar to that in Figure 1 of ROC Curve, except that only the upper bounds of the intervals are shown in column A. These correspond to the bins in the histograms, except that we now have two frequency columns (B and C) instead of just one.
Analysis
To perform the analysis, press Ctrl-m and double-click on the ROC Curve and Classification Table data analysis tool. Fill in the dialog box that appears as shown in Figure 2.
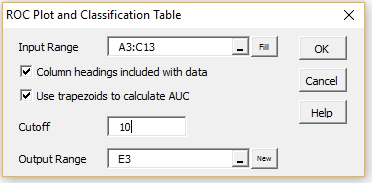
Figure 2 – ROC Curve and Classification Table dialog box
Note that we choose a cutoff at the 5th row of the data by specifying the upper limit of the failure range, namely 10. Also, note that in Example 1 of ROC Curve we estimated the area under the ROC curve (AUC) via rectangles. This time we estimate AUC by using trapezoids instead.
After clicking on the OK button in the dialog box, the output shown in Figure 3 is produced.

Figure 3 – Output from the data analysis tool
In addition, the output also includes the ROC curve shown in Figure 1 of ROC Curve.
The classification table is identical to that shown in 1 of Classification Table and the ROC Table except that the AUC values are the same as that shown in Figure 1 of ROC Curve. The AUC values are slightly different since the area under the ROC curve is estimated via trapezoids instead of rectangles.
Observations
If we use the data from Figure 1 of Classification Table as input then we would insert B24:C34 (two-column format) from Figure 1 of Classification Table into the Input Range field in the dialog box in Figure 2 and set the Cutoff to 5 (5th row). The output would be the same as that described above.
The output shown in Figure 3 also includes the 95% confidence interval for the AUC (range M12:M15). Note that the 95% corresponds to an alpha value of .05 in cell M12 since 95% = 1 – .05. You can change the alpha value in M12 of the output and the corresponding confidence interval will change automatically (e.g. inserting .01 in M12 will generate the 99% confidence interval in M14 and M15).
Links
↑ ROC curve and classification table
Examples Workbook
Click here to download the Excel workbook with the examples described on this webpage.
References
Hanley, J. A., McNeil, B. J. (1982) The meaning and use of the area under a receiver operating characteristic (ROC) curve
https://pubmed.ncbi.nlm.nih.gov/7063747/
Hintze, J. L. (2008) ROC Curves. NCSS
https://www.ncss.com/wp-content/themes/ncss/pdf/Procedures/NCSS/ROC_Curves-Old_Version.pdf
Hintze, J. L. (2022) One ROC curve and cutoff analysis. NCSS
https://www.ncss.com/wp-content/themes/ncss/pdf/Procedures/NCSS/One_ROC_Curve_and_Cutoff_Analysis.pdf
IBM (2011) ROC algorithms IBM SPSS Statistics Algorithms
https://public.dhe.ibm.com/software/analytics/spss/documentation/statistics/24.0/en/client/Manuals/IBM_SPSS_Statistics_Algorithms.pdf
Hi Charles,
I have 6 rows, but when plotting ROC and calculating AUC, there is an extra row with value 1,1. This increases the AUC. Do I need to include this value or not?
Thanks,
Jagan
If you have 6 rows, you should include all 6 rows. If you have 7 rows, you should include all 7 rows. Etc.
Charles
i am sorry…. but may i
i have an elementary question!
you say that “cutoff” is upper limit of failure range… right?
i can’t fully understand that meaning.
Yes, the cutoff is the upper limit of the failure range. The cutoff divides the failure range from the success range.
It is an arbitrary value. You can choose any value that you think makes sense.
Charles
thank you so much~~
there’s another question.
Fail-Obs Suc-Obs
Fail-Pred 413 58
Suc-Pred 114 221
above 2*2 matrix is made by figure 1 and 2.
in terms of medical statistics, i think that (fail-pred*fail-obs) is sensitivity, and (suc-pred*suc-obs) is specificity. am i right?
Hi Charles,
Many thanks for the great statistical tool you have created and generously share.
I am investigating the relationship between injury and various musculoskeletal test outcomes. Set scores (cut-offs) have been proposed by the developers of the tests i.e. scores for minimum standard achieved or not achieved. Based on these scores classification tables have already been constructed. You mention that the Real Stats data analysis tool can create ROC curves and AUC values from classification tables also. Please could you advise how this can be done as oppose to using the format as described in the above example?
Hello Candice,
You can’t create the ROC from the classification table. The reference on the webpage is to the webpage titled Classification Table.
Charles
Hello Charles,
Hope you are well amidst Corono outbreak.
I need to validate an established diagnostic criteria (say a fixed Bilrubin and Serum Albumin cut off) on a set of say 30 cases.
Result will be binary; with either diagnostic criteria met or not met in 30 cases (includes patients and not patients).
Can ROC curve be generated from the above results? If so, how?
Thanks.Dr. Tryambak (INDIA)
Hello Dr. Tryambak,
The approach is exactly as in Figure 1. Column B contains the counts for binary value 0 and column C contains the corresponding counts for binary value 1.
Charles
Charles,
Thanks for your prompt reply.
However I don’t have a column A.
I have a fixed criteria (say Bilrubin 5mg and Albumin 3) . No different set of values.
I am bit confused. Please help me.
Thanks.
Tryambak
When I highlight data to be used for ROC curve, I get a message that says only non-negative integers can be used, although none of my data contains negative numbers.
Velda,
If you email me an Excel file with your data I will try to figure out why you are getting this error message.
Charles
i also get this error, have you looked into this Charles?
Hello Luke,
If you email me an Excel file with your data I will try to figure out why you are getting this error message.
Charles
Please refer to the quote, and let me know whether we should use ‘trapezoids’ instead of rectangles to calculate ROC using the provided tool?
“The AUC values are slightly different since the area under the ROC curve is estimated via trapezoids instead of rectangles.”
Trapezoids give a slightly more accurate measure of the area under the curve.
Charles
@Charles Thank you for prompt response. Can you please further enlighten me. I have noticed that using trapezoid has significant impact on resultant AUC value in contrast to considering rectangles for the purpose.
Hello Nasir,
Can you give me an example where there is large difference in AUC depending on whether rectangles or trapezoids are used?
Charles
And How do you determine cutoff point if you don’t have one? The data I am using, technically we’re looking to point out a cutoff point but I don’t know where to look besides follow the sum of sensitivity+specificity (highest).
Hi Anne,
This should ideally be determined based on your domain knowledge, i.e. not on statistical grounds but on what makes sense for your field of study.
You could, however, use the cutoff that maximizes the Accuracy (or some other statistic). In Excel you can determine this value by using Solver.
Charles
There’s no comment section for AUC Confidence Interval page, so I am leaving a question here. How to calculate p-value for the AUC and ROC?