Objective
When the assumption of equal population variances is not met for the Two-Sample t-Test with Equal Variances (or when you don’t have enough evidence to know whether it holds) you should consider using a modified version of the t-test. This version is based on the following property.
Key Property
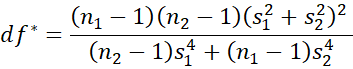
Property 1: Let x̄ and ȳ be the sample means and sx and sy be the sample standard deviations of two samples of size nx and ny respectively. If x and y are normally distributed, or nx and ny are sufficiently large for the Central Limit Theorem to hold, then the random variable
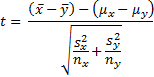
has a t distribution T(df) where the degrees of freedom is expressed as
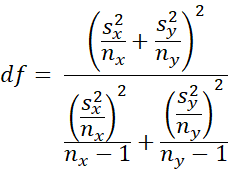
The nearest integer to df is sometimes used.
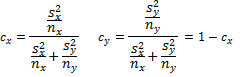
An alternative version (Satterthwaite’s correction) of df (which has the same value) is calculated as follows
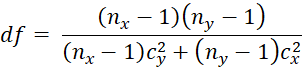
where
Welch’s t-Test
Property 1 can be used to test the difference between sample means even when the population variances are unknown and unequal. The resulting test is called Welch’s t-test. The degrees of freedom for this test will be smaller than (nx – 1) + (ny – 1), the degrees of freedom for the t-test where the variances are equal.
When nx = ny then the value of t in Property 1 is the same as in Property 1 of Two-Sample t-Test with Equal Variances. If, in addition, the variances are equal, then the df values are also the same, which means the p-values of the two tests are the same.
Worksheet Functions
Real Statistics Function: The Real Statistics Resource Pack provides the following function.
DF_POOLED(R1, R2) = degrees of freedom for the two-sample t-test with unequal variances for samples in ranges R1 and R2 (i.e. df in Property 1).
Excel Function: Excel provides the function T.TEST to handle the various two-sample t-tests.
T.TEST(R1, R2, tails, type) = the p-value of the t-test for the difference between the population means based on samples R1 and R2, where tails = 1 (one-tailed) or 2 (two-tailed) and type takes one of the following values:
- the samples have paired values from the same population
- the samples are from populations with the same variance
- the samples are from populations with different variances
These three types correspond to the Excel data analysis tools
- t-Test: Paired Two Sample for Mean
- t-Test: Two-Sample Assuming Equal Variance
- t-Test: Two-Sample Assuming Unequal Variance
Note that when type = 3 the T.TEST function uses the value of the degrees of freedom specified in Property 1 unrounded, while the associated Excel data analysis tool rounds this value down to the nearest integer. On this webpage, we explain how T.TEST is used when type = 2 or 3, while we describe the version where type = 1 in Paired Sample t Test.
The T.TEST function is not available in versions of Excel prior to Excel 2010. For these versions of Excel, the equivalent TTEST function is used instead.
The T.TEST and TTEST functions ignore all empty and non-numeric cells. Both tests assume that α = .05.
Example
Example 1: In Example 1 of Two-Sample t-Test with Equal Variances, we assumed that the population variances were equal since the sample variances were quite similar. We now repeat the analysis assuming that the variances are not necessarily equal.
We use the Excel formula T.TEST(A4:A14,B4:B14,2,3). The first two parameters represent the data for each sample (without labels). The 3rd parameter indicates that we desire a two-tailed test. Finally, the 4th parameter indicates that we are employing a t-test with two independent samples from populations whose variances are not assumed to be equal. Since
T.TEST(A4:A14,B4:B14,2,3) = 0.042642 < .05 = α
we reject the null hypothesis. Note that if we use type = 2, i.e. T.TEST(A4:A14,B4:B14, 2, 2) = 0.040219, the result won’t be very different, which is consistent with the fact that the sample variances are similar (and presumably so are the population variances).
Example 2: Repeat the analysis for Example 1 but with different data for the new flavoring as shown in Figure 1.

Figure 1 – Sample data and box plots for Example 2
Clearly, the sample variances are quite unequal. Using the T.TEST function with type = 3 we get
T.TEST(A4:A13 ,B4:B13, 2, 3) = 0.05773 > .05 = α
and so this time we cannot reject the null hypothesis (for the two-tailed test). Note that if we had used the test with equal variances, namely T.TEST(A4:A13, B4:B13, 2, 2) = 0.048747 < .05 = α, then we would have incorrectly rejected the null hypothesis.
Data Analysis Tools
We can also use Excel’s t-Test: Two-Sample Assuming Unequal Variances data analysis tool for Example 2. From Figure 2, we see that the results are the same.

Figure 2 – Data analysis for the data from Figure 1
Note that the p-value returned by T.TEST is slightly different from that reported by the data analysis tool. This is because the data analysis tool rounds the df to the nearest integer while T.TEST does not.
We can also use a Real Statistics data analysis tool to conduct this test or other versions of the t-test. Click here for details and examples.
Equal Variances Assumption
Generally, even if one variance is up to 3 or 4 times the other, the equal variance assumption will give good results, especially if the sample sizes are equal or almost equal. This rule of thumb is clearly violated in Example 2, and so we need to use the t-test with unequal population variances.
If the variances are equal then the equal and unequal variances versions of the t-test will yield similar results (even when the sample sizes are unequal), although the equal variances version will have slightly better statistical power.
Effect Size
The calculation of the effect size and the effect size confidence interval is the same as for the case where the two samples have equal variances. If the variances are very different, then it might be better to use the variance of one of the samples (e.g. the one representing the Control group) instead of the pooled variance. This version of Cohen’s d effect size is called Glass’ delta.
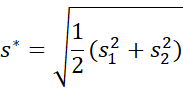
Cohen’s d* and Hedges’ g*
Another approach is to use Cohen’s d* which is defined by
![]()
where
We can now define the less biased Hedges’ version of this effect size, namely
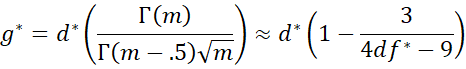
where m = df*/2 and
Example
We can calculate d* and g* for Example 2 using the data in Figure 2 as shown in Figure 3.
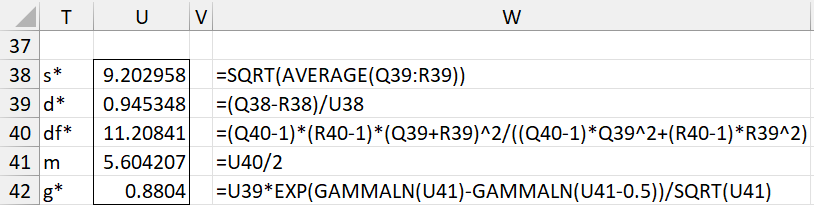
Figure 3 – Cohen’s d* and Hedges’ g*
Interpretation
The default interpretation of Cohen’s d* effect size is
- .20: small effect
- .50: medium effect
- .80: large effect
Confidence Intervals
Click here for a description of how to estimate confidence intervals for Cohen’s d* and Hedges’ g*.
Examples Workbook
Click here to download the Excel workbook with the examples described on this webpage.
References
Howell, D. C. (2010) Statistical methods for psychology (7th ed.). Wadsworth, Cengage Learning.
https://labs.la.utexas.edu/gilden/files/2016/05/Statistics-Text.pdf
Microsoft Support (2022) T.TEST function
https://support.microsoft.com/en-us/office/t-test-function-d4e08ec3-c545-485f-962e-276f7cbed055
Delacre, M., Lakens, D., Ley, C., Liu, L., Leys, C. (2021) Why Hedges’ g*s based on the non-pooled standard deviation should be reported with Welch’s t-test
https://psyarxiv.com/tu6mp/download
Hello
I used t-test for two tailed unequal variances in excel and I obtained t stat greater than critical t value, however my p-value is 3.95249E-06. I do not know whether I have to say there is a significant difference or reject that because p-value is greater than 0.05.
Another issue is when I use T.tests function my t stat is different from when I use data analysis in excel. I do not why?
I am appreciated for your guidance.
Narges,
3.95249E-06 is the same as .00000395249 which less than alpha = .05, and so you have a significant result.
The two t stat values should be the same. If you email me an Excel file with your data and test results, I will try to determine why you are getting a different result.
Charles
Narges,
If your input range doesn’t contain headings then do you tick off “Column headings included with data” in Real Statistics before you run the analysis? It is easy to forget if you’ve beean using add-in for a while with a different set up.
Tim,
Yes, you need to unclick “Column headings included with data” on the dialog box.
Charles
Hello Charles,
I am slightly confused by the following question. Any guidance would be very much appreciated.
Intuitively, what difference do you think it makes for the variance of the sampling distribution if the sample data are not independent, but positively correlated?
Many thanks
Hello David,
I am not sure what is meant by the sampling distribution, but I suggest that you look at what the difference is between the two-sample t-test (not correlated) and the paired t-test (correlated).
Charles
I have a Pop. SD of 50 mm, a sample of 15 at 64 mm SD and 0.05 significance. Is this the test I should use?
Tom,
No, this doesn’t look like the correct test.
What hypothesis do you want to test?
Charles
with a two sample test with these Variance 11.76666667 15.55357143
please will i conduct an unequal variance test or equal variance test
Eunice,
You can use the equal variance test, although the result won’t be much different if you use the unequal variance version.
Charles
Hi,
Can I use excel if I dont have a set of data, but rather the actual information?
Here is the question:
A financial planner wants to compare the yield of income and growth oriented mutual funds. Fifty thousand dollars is invested in each of a sample of 35 income-oriented and 40 growth-oriented funds. The mean increase for a two-year period for the income funds is $1100 with a standard deviation of $45. For the growth-oriented funds the mean increase is $1090 with a standard deviation of $55. At the 0.01 significance level is there a difference in the mean yield of the two funds?
I know that I want to use the t test with unequal variances, and I know how to input this in excel if I had the actual sample points, but because the SD and mean etc are already calculated, how can I utilize Excel? Thanks!
Leah,
1. Yes, you can use the t-test if you have the means, standard deviations and sample sizes, even if you don’t have the actual data.
2. The t-test is appropriate provided the assumptions for the test are met. In particular, you need to make sure that the funds in each group are randomly selected and the data in each group is normally distributed. The t-test is pretty robust to violations of normality and so you are probably ok, but it would have been better to have the data so that you could test for normality.
3. Since the variances of the two samples are pretty similar you can even use the equal variances version of the t-test, although the results won’t be much different if you use the unequal variances version.
Charles
Hi, Sir. May I ask how to compute for the T-Test/Z-Test via Excel even if without the data? Thank you.
Hello Grace,
If you don’t have the raw data, what summary data do you have?
Charles
Hello sir,
I have these two sets of data:
With Mg addition: 3.03, 2.99, 3.08
Without Mg addition: 1.77, 1.72, 1.80
As sample size is small (n=3 for each group), which test is appropriate if I want to study a significant difference?
Thanks
The two-sample t-test is appropriate since the two samples are normally distributed. Usually with such a small sample, the power of the test will be poor, but since the effect size difference is so large, the power will be adequate.
One other thing: since the variances are quite similar you can use the equal variance version of the test.
Charles
Dear Charles,
I have to compare the value of a biological variable in two different conditions, say A and B.
The device that measures the variable makes 5 series of 100 measurements each in a very short period of time; then, it calculates the mean of each series;
finally, it computes the average and the standard deviation of the 5 means.
So I have the average and the s.d. of the 5 means for each condition A and B.
What I have to put as n (degrees of freedom) in the t-test, is it 5 or 100?
And what are the right variances to put in the t-test?
I’m a little confused about this ….. please could you help me?
Thank you very much
Piero
Piero,
This doesn’t seem to be a fit for the t-test.
If I understand correctly, you have two samples: A and B. For each sample you know the sample size, mean and standard deviation. You could use a Two-sample Proportion Test. See https://real-statistics.com/binomial-and-related-distributions/proportion-distribution/
Charles
Hi Charles,
I probably didn’t explain my experiment very well.
I have only one subject (one person). On this person, a biological variable is measured 5 times when he is in a particular condition A (say, when he is standing), and therefore 5 times when he is in condition B (say, when he is sitting).
I do not have the 5 measurements that are taken in each condition A and B, but only their average and s.d.
Furthermore, I know that each of the above 10 measures actually derives in turn from the average of 100 samples.
I have to check if the value of the variable is statistically different between when the person is sitting and when he is standing. I read the page on proportional distribution, but I don’t know if it fits my situation, so I was thinking about a t test.
Thank you very much
Piero
Hi Charles,
please, disregard my question above; in fact, I realized that in my test the hypothesis of the Central Limit Theorem are not satisfied.
In fact, the 5 average of measurements are computed as follows:
measures 1 to 100 —> Mean #1
measures 101 to 200 —> Mean #2
and so on
but this implies that the samples of 100 measurements each cannot be considered as a “random sampling” from the population of all possible measurements of the variable to test, so the relationship between the standard deviation of the mean and the standard deviation of the population given by the Central Limit Theorem, does not holds, as the random sampling hypothesis is not satisfied.
Sorry for my wrong question
Piero
Hello Piero,
The combination of averages of averages and lack of independence makes me think that neither test is appropriate. This looks more like a fit for Bland-Altman of Lin’s CCC, but these don’t seem to fit either.
Charles
Hello Charles,
considering the physical nature of the phenomenon, within each group of 100 measurements there is very little variability; instead, there is greater variability between each group of 100 measures and the other groups.
So if I considered what I called in my post earlier as mean #1, mean #2 etc. as if they were single measures, could it be right to apply a t test with n = 5?
Piero
Piero,
If I understand the situation correctly, you could perform the test with n = 5.
You lose all the variability within each group of 100. Perhaps this could be captured using a test such a Split-Plot ANOVA.
Charles
Hi sir.
I am doing my master research based on several parameters and I want to check whether those paramaters give significant effect on several properties. My question is should I use unequal variance? If so, why? I have zero idea on statistical analysis. Hope you can guide me. Thank you.
Hello Rika,
What are the values of the variances of each of the two samples? You can calculate this using the VAR.S function.
Charles
Hi everybody
I need some information about tan θ test which used for unequal variances.
Can you help me?
Thank you.
Sorry, Sahar, but I am not familiar with a tan θ test.
Charles
hi sir…em doing research n the objective is finding burnout level through demographic info (Gender, Age, Status…etc) … for this i used t-test and one-way ANOVA…but all sig and sig (2tailed) values are more then .05….so can i write that female experience burnout more then male…..???? plz help me because i think my supervisor is also confused n not guide me properly
Hello Nabeela,
This depends on the details. E.g., suppose you used the t test on two independent groups, one male and one female, and got an insignificant test result (i.e. p-value > .05), then you cannot conclude that females experience burnout more than males. In fact, this would mean that you have not found sufficient evidence that the populations of males and females have significantly different burnout.
Charles
Hello Sir,
plz explain me the below results,, as I am group of data for parameters difference. I did t test for unequal variances.. here I should consider p value or T stat.. p value is awkword here.. am I using wrong test?
Variable 1 Variable 2
Mean 41.58333333 30.24
Variance 0.129733333 0.0523
Observations 3 3
Hypothesized Mean Difference 0
df 3
t Stat 46.04959986
P(T<=t) one-tail 1.12727E-05
t Critical one-tail 2.353363435
P(T<=t) two-tail 2.25453E-05
t Critical two-tail 3.182446305
Thank you
Hello Seema,
The value 2.25453E-05 is written in scientific notation and is equivalent to .0000225453, which is a very small probability, indicating a significant test result.
Charles
Thank you Sir for clearing this major doubt
I got one more confusion.. I am comparing same crop, for example cabbage, i am observing same nutrients parameters but the maturity is different, one sample is from raw cabbage ebible part (2.5 months old), and second set of samples is its microgreens part (10 days old) what t test should be applied? paired or un equal variances
first set
Principle Nutrients Raw Cabbage R1 R2 R3 Mean
Potassium mg/Kg 2972 2973 2971 2972.00
Manganese mg/Kg 2.3 2.25 2.28 2.28
Magnesium mg/Kg 168 167.00 169.00 168.00
second set
Principle Nutrients Raw Cabbage R1 R2 R3 Mean
Potassium mg/Kg 162 161 155 159.3333333
Manganese mg/Kg 0.62 0.6 0.56 0.593333333
Magnesium mg/Kg 34.2 33.5 33.8 33.83333333
kindly suggest in this case
Generally, if the samples are from different subjects (plants?) then you would use the two independent sample test.
Charles
Hello there, I am having trouble writing out a hypothesis test for a problem I am doing before I do the t-test and I was hoping you might be able to help me out with this?
Hi Danielle,
Sure. What difficulty are you having?
Charles
Hi Charles,
My professor asked me to do a t-test using unequal variances for sex and weight. She wants me to sort the sex too. How do I do that in excel?
Hello Melissa,
See Sorting
Charles
Hello….how can I use Minitab in displaying data to test the hypothesis that the variance of the 5-year return for growth funds is different from the variance of the 5-year return for value funds. I also have to report and interpret the p-value of this test. I have 4 columns. My variables are Expense Ratio and 5-Year Return. My objective column consists of growth and value. My risks column consists of High, Average, Low. I have a total of 868 samples.
Sorry Dawn, but I don’t use Minitab. To compare two variances using Excel, see
https://real-statistics.com/chi-square-and-f-distributions/two-sample-hypothesis-testing-comparing-variances/
Charles
Charles
MY Experiment t test statistics gave following results
Can i take that significant difference between two sample means
t-Test: Two-Sample Assuming Unequal Variances
Variable 1 Variable 2
Mean 37.48666667 30.40888889
Variance 34.5718 33.03076111
Observations 9 9
Hypothesized Mean Difference 0
df 16
t Stat 2.582477836
P(T<=t) one-tail 0.010020491
t Critical one-tail 1.745883676
P(T<=t) two-tail 0.020040982
t Critical two-tail 2.119905299
These results show that there is a significant difference between the two samples (at least assuming alpha = .05).
Note that since the variances are almost the same, you could have used the Equal Variances version of the t test.
Charles
Thank you Charles for your swift and immediate response
Hi Charles,
I’m running a two-tailed hypothesis test to test whether my two samples of n1 (n=26) and n2 (n=29) have zero mean difference. Note that they are taken from the same population.
I’m confused as to which excel data analysis toolpak to use – t-test or z-test?
Appreciate the help. Thanks
Hi Alex,
If you know that both samples are taken from the same population, then there is no reason to conduct the test since this is what the t-test and z-test are testing. If the mean difference is zero, then either test is likely to give the same answer, namely no significant difference.
In general, if you have the sample data then you should use the t-test. If, instead, you know the true variance then you can use the z-test.
Charles
Hello, can you please confirm if my interpretation of this data is correct? I will be rejecting the null hypothesis.
Mean 6.140416667 | 6.196666667
Variance 1.072923227 | 1.216209929
Pooled Variance 1.144566578
df 94
t Stat -0.257577318
P(T<=t) one-tail 0.398648086
t Critical one-tail 1.661225855
P(T<=t) two-tail 0.797296173
t Critical two-tail 1.985523442
No, since p-value = .797 > .05, you shouldn’t reject the null hypothesis.
Charles
When am I going to use two-tailed and one-tailed p-value? My null hypothesis for stroop effect states that color-naming responses is slower with emotion-related words
If you are pretty certain that one of the tails can’t happen, then you can use a one-tailed test; otherwise, you should use a two-tailed test.
Charles
Hello, I am finiding it difficult to interpret my data and not sure weather to accept the null hypothesis or to reject it.
Mean 143.355 156.938
Variance 1198.265 1991.319
Observations 28.000 28.000
Hypothesized Mean Difference 0.000
df 51.000
t Stat -1.273
P(T<=t) one-tail 0.104
t Critical one-tail 1.675
P(T<=t) two-tail 0.209
t Critical two-tail 2.008
Since p-value = .209 > .05 = alpha, you would usually consider this as supporting the null hypothesis.
Charles
Hello I would like some help reading this table:
t-Test: Two-Sample Assuming Unequal Variances
a = 0.05
F M
Mean 2.22 3.00
Variance 0.19 1.20
Observations 9 11
Hypothesized Mean Difference –
df 14.00
t Stat (2.15)
P(T<=t) one-tail 0.02
t Critical one-tail 1.76
P(T<=t) two-tail 0.05
t Critical two-tail 2.14
Which fields don’t you understand?
Are you running a one-tailed test or a two-tailed test?
Charles
Hi,
Acrually I don’t know which t-test that should I use whether paired t-test, equal or unequal variance. Im doing a project on trichome. I counted the trichome density on upper and lower part of leaves. each part, I do triplicate. So, which t-test is suitable for my project? Hope to hear from you soon.
I want to campare the trichome densities at abaxial and adaxial
It depends on the hypothesis that you are testing. If you are comparing the upper and lower part of the leaves then you probably need to use the paired t test.
Charles
Hi Charles,
Pls help me.
I don’t know which t test to used.
With video 9,6,1,5
Without video 8,6,5,9
Thank you.
A. 0.05
Sofia,
When in doubt use the t test with unequal variances. The Real Statistics data analysis tool gives the results from both versions of the test.
Charles
Hi, I have conducted my f test and I have to reject null hypothesis because the p value which is 0.00025 is less than 0.05. I have chosen to use the two sample difference of means testing unequal variance. Going further to perform the unequal variance, what will my null and alternative hypothesis be? I am confused as to whether it is = to and not equal to or it is equal to and greater than.
Hello Hope,
Generally, you perform a t test and not an f test when comparing two means (although perhaps this is just a typo).
You use the = null hypothesis with a 2 tailed test and a greater than or equals when using a one-tailed test. See
Null Hypothesis.
Charles
Hi Charles,
it is quite mind boggling indeed. Here are the values in case you want to test:
group 1: 4,4,4,3,3,4,1,3
group 2: 4,5,4,4
the group 1 has 8 cases while the group 2 has 4 cases. I have 12 cases in total.
any suggestion how I should proceed? can i say the difference is significant?
Thanks for your reply.
Hi Khalid,
1. The variance of the first group is more than 4 times the second, and so you should use the unequal variance test, especially because the sample sizes are so different.
2. The second problem is that the samples are not normally distributed and so it is not clear that the t test is even the right test. Since the data is reasonably symmetric probably this is not a problem, but in any case I used the non-parametric version of the t test, namely the Mann-Whitney exact test to arrive at a p-value = .109 which would not be significant.
3. Now the means of the two samples are 3.5 and 4.5 and based on the t test we get p-value = .048, which is a significant difference. The medians of the two samples are 3.4 and 4 and based on the Mann-Whitney exact test we get p-value = .109, which is not significant. Thus, whether or not there is a significant different really depends on how you interpret things. With such a small sample, in general you can’t expect too much.
Charles
Very helpful comments. Many thanks.
Hi charles!
May i ask if what are the formulas used in t-test unequal variance? Thanks!
They are listed on this webpage.
Charles
Hi Charles,
I have equal variances assumption not violated, but the sig(2-tailed) is .102 in this scenario. If equal variances is not assumed, then sig(2-tailed) becomes .048
Can I conclude that the result is statistically significant? Considering that the equal variances actually not violated?
Many Thanks.
Hello Khalid,
It is quite strange that the results would be so different given that the equal variances assumption is not violated. p = .048 would yield a significant result.
Charles
Hi,
How do i know which t-test is appropriate to use (equal variance or unequal variance) when an F-test produces unequal variance results?
Hi, if the F test shows unequal variances, then you should use the unequal variances t test.
In general, when in doubt, use the unequal variances version of the t test. If the variances are actually pretty similar, the results of this test won-t be very different from the equal variance version of the t test.
Charles
how do I solve a two equal number of sample size using an unequal variance t test by hand?
Hello Silas,
The formula is written on the top of the webpage. You just need to replace n_x and n_y by the same variable, say n, and simplify.
Charles
Hi,
I have some questions about interpretation of excel outputs like Figure 2.
How can you tell if this is a left (lower) tailed test or a right (upper) tailed test?
In addition, how can you tell which one will be μ 1 or μ 2.
This looks like a right tailed test because the t -stat is positive, but then the p-value is
P(T<=t). This means it is a left-tailed test. Needs some help here. Thank you.
Hello JayC,
The sum of the p-values for the left tail plus the right tail is 1. Thus, one tail will have a p-value >= .5 and the other will have a p-value <= .5. The report will show the p-value of the tail that is <= .5. Which is which should be clear from looking at the sample means. Charles
Thanks for your comment, but I still have a question about the null and alternative hypotheses looking at the result (Figure 2).
For one tail test, is it
H0: μ 1 > = μ 2
H1: μ 1 < μ 2 ?
or vice versa?
and is the mean for New, μ 1 (or μ 2)?
Thank you.
See https://real-statistics.com/hypothesis-testing/null-hypothesis/
Charles
Hai, im from Indonesia and im sorry for my English below..
I’ve got a question mentioning 2 kind subject which have different means. And 2 Standard deviationa. The first subject included 27 men and second 22 women. NO VARIAN. And the question doesn’t mention any data collected.
How can I compute the data? Thanks in advance, sorry for my writing
How do I determine whether I have equal or unequal variances?
Hi JC,
See Homogeneity of Variances
Charles
using the f test
what if there is no p one tail and two tail provided. only t stat and t crit
Kaijo,
Are you saying that the Real Statistics data analysis tool is not working properly or are you saying that some other tool only reports the t stat and t crit values?
Charles
Hi, I am stuck on a two-population test problem. I have this data set:
set 1: 14 27 19 17 19 12 15 15 21 19
set 2: 16 18 17 16 16 11 15 12 21 18
And my significance is 0.05.
The part I am stuck on is how to determine at this point if I should use the homogeneity formula or the heterogeneity formula. Can you please explain how I come to this determination?
If the variances of the two samples are not too different then you can use the homogeneity version of the t test. This formula is pretty robust; even when the variance of one of the samples is 2 or 3 times the other(and sometimes even 4 times), the formula should do fine. In any case, when in doubt, use the heterogeneity version of the t test since when the variances are similar, the results from this version will be pretty similar to the homogeneity version.
Charles
Hey!
I’m not sure if my data is significant or not. My hypothesis is that the means of the two samples are equal. Looking at this information, I don’t know how to analysis whether to reject my hypothesis or not.
N Mean St. Dev SE Mean
Sample 1 26 201.692 53.036 10.4012
Sample 2 24 187.791 32.036 6.5393
Observed difference (Sample 1 – Sample 2): 13.901
Standard Deviation of Difference : 12.2861
Unequal Variances
DF : 41
95% Confidence Interval for the Difference ( -10.9108 , 38.7128 )
Test Statistic t = 1.1314
Population 1 ≠ Population 2: P-Value = 0.2644
Population 1 > Population 2: P-Value = 0.8678
Population 1 < Population 2: P-Value = 0.1322
I know I have to look at Population 1 =/ Population 2, but I'm not sure what to do with this info.
Krupali,
Since the p-value = .2644 (for the 2 tailed test) is larger than .05 (since you are looking at 100-95% = 5% significance, you would conclude that there is no significant difference between the two populations.
Note that we don’t speak about the data being significant. Instead we are interested in differences between two populations based on the data we have.
Charles
If you reject the null hypothesis, how would you determine the sample that has the more mean
Oj,
You calculate the mean for each sample, and pick the one that is larger. If the null hypothesis is rejected, then the group that has the larger sample mean also can be considered to have the larger population mean.
Charles
i am a metalurgist working in a company inerested in interpreting stastical findings
Aron,
Do you have a specific question about this?
Charles
Hi sir can you please interpret this for me
Variable 1 Variable 2
Mean 22 14.57142857
Variance 24 17.28571429
Observations 7 7
Hypothesized Mean Difference 0
df 12
t Stat 3.058823529
P(T<=t) one-tail 0.004960354
t Critical one-tail 1.782287556
P(T<=t) two-tail 0.009920709
t Critical two-tail 2.17881283
Marc,
Since the the p/value is so low, you would likely conclude that there is a significant difference between the two populations.
Charles
Doesn’t the hypothesis mean diff = 0 pass in this case, since p value is low. Meaning the hypothesis that mean diff is zero = true meaning no significant diff between populations?
The null hypothesis is that the means are equal, i.e. the mean difference is zero. If the p-value is sufficiently low (i.e. you have a significant result), then you reject the null hypothesis and conclude that the means are not equal.
Charles
Hi
thank you for the useful post, I have a question :
Can I use Two Sample t Test for measuring the similarity between two different samples
Najat,
It depends on what you mean by “similarity” and whether you are referring to the populations or the samples.
Statistical tests measure the “similarity” between the populations from which the samples are taken. The t test, in particular, is used to determine whether the population means are likely to be the same.
Charles
Hi Charles
I mean measuring the similarity between the samples
Actually, I am working on clustering two different datasets, the two data set from the same domain (weather data set for two different cities), they have the same number of objects and the same type of attributes, I have obtained 3 clusters for each dataset with different sizes.
for evaluating the results let us assume that, each cluster is a sample, I want to compare cluster 1 from the first data set with cluster 1 from the second dataset, same with cluster2 from the first data set with cluster 2 from the second and so …
I am planning to apply t-test or z-test, to find the difference between the mean of each two clusters
is measuring the difference between them useful in this case
I have read a lot about them, my datasets are very large and the samples are large, based on the size of the samples z-test is a good choice.
Please tell me is it ok to apply a statistical method such as t-test or z-test to compare the clusters of different datasets
Thanks
Najat,
You don’t need a t test or z test to compare samples. These tests are used to compare the populations from which the samples are drawn.
BTW, the Real Statistics website also describes clustering techniques.
Charles
Hi Charles,
I have a question to the theorem, hope you can help me. Why is, in the case of different unknown variances, the df for t statistic not (nx + ny) – 2. That is the case when there are unknown but equal variances. I would think that in the case of different unknown variances as when they are equal, there should be just two not independent observations (one for each sample variance). I ´ve been trying to make sense to this, I would really appreciate if you give me some insights or recommend me some good reading. Thank you very much
Francesco,
The test in the case where the variances are unequal involves reducing the df, as explained on the Real Statistics webpage. You can read the original papers to understand why this approach is useful.
Charles
In t-independent test, usually w e use the equal variances or unequal variances for sig value, df etc?
Hieng,
You should use the version that applies. When in doubt, use the version with unequal variances.
Charles
Good Day Charles,
I was wondering if you could possible help me with the interpretation of my results.
t-Test: Two-Sample Assuming Unequal Variances
Grass basal cover (%) Forb aerial cover (%)
Mean 23,44285714 4,828571429
Variance 107,1457143 47,71604396
Observations 14 14
Hypothesized Mean Difference 0
df 23
t Stat 5,596780835
P(T<=t) one-tail 5,37479E-06
t Critical one-tail 1,713871528
P(T<=t) two-tail 1,07496E-05
t Critical two-tail 2,06865761
I was also wondering if you could please explain to me what df is indicative of.
Thank you for your time and assistance
Jade,
Since the p-value is close to zero, you have a significant result. In the case of equal variances, df = n1 + n2 – 2 where n1 and n2 are the two sample sizes. When the variances are unequal (or you use the unequal variances test), this value is reduced to compensate for the fact that the variances are unequal.
Charles
Thank you so much for your assistance and fast reply.
One last question, would the fact that I have a significant result indicate that I can reject the Null Hypothesis?
Jade,
Yes, that is correct.
Charles
Thank you once again for your assistance.
Regards
Hi Charles this is a great resource thanks.
Just a few questions on the t-test:
-why would you click on the non parametric options in the real stats add in
-if you are ticking them, why would you not tick the non parametric option under test type section?
-what do each of the options represent?
-is there an alternative to the levene test included in the analysis to check on homogeneity of variance or is there such an option elsewhere?
-why would the real stats analysis tool run the equal and non equal variances option simultaneously?
Thanks Charles.
Demos.
Demos,
Glad you like the Real Statistics resources.
-why would you click on the non parametric options in the real stats add in. Perhaps someone who wants to perform say the Mann-Whitney test would expect to find it with the other nonparametric tests rather than with the t test.
-if you are ticking them, why would you not tick the non parametric option under test type section? If you know that the assumptions for the t test are satsified, then you would have no reason to click on the Nonparametric option.
-what do each of the options represent? These are described at https://real-statistics.com/real-statistics-environment/supplemental-data-analysis-tools/
-is there an alternative to the levene test included in the analysis to check on homogeneity of variance or is there such an option elsewhere? The Fligner-Killeen test and Bartlett’s test are also supported (via functions). See the following webpage for details: https://real-statistics.com/one-way-analysis-of-variance-anova/homogeneity-variances/
-why would the real stats analysis tool run the equal and non equal variances option simultaneously? This was done to make it easier to compare the results. Generally you should pick one or the other in advance, although when in doubt you could simply pick the unequal variance test since even when the variances are equal, the result will be fairly similar to the equal variance version.
Charles
Thanks a heap Charles!
Last question: when reading Tabachnick, when running a t-test and the sample is smaller than 100, skewness or kurtosis is a problem if skewness or kurtosis divided by its standard error (resulting in a z score) is > + 3.29 (p <.001). Although I can insert a formula to divide skewness/ kurtosis by the std error, I would not be able to see if is stat significant. Any advice on this?
Thanks Charles!
Demos.
Demos,
I don’t have access to Tabachnick’s textbook, but most likely he is commenting on the normality assumption of the t test. For samples bigger than 100, he is probably relying on the Central Limit Theorem. For smaller samples, he is cautioning that the data may have skewness or kurtosis values that are inconsistent with a normal distribution.
I usually test for normality by using the Shapiro-Wilks test, but there are also tests for skewness and kurtosis. See the following webpage for details:
https://real-statistics.com/tests-normality-and-symmetry/statistical-tests-normality-symmetry/dagostino-pearson-test/
The following webpages may also be interesting:
https://real-statistics.com/tests-normality-and-symmetry/statistical-tests-normality-symmetry/shapiro-wilk-test/
https://real-statistics.com/tests-normality-and-symmetry/analysis-skewness-kurtosis/
Charles
Hi Charles,
Great article!
I have doubt in this case:
SAMPLE 1:
95
123
74
145
64
112
107
67
81
91
142
84
85
92
112
112
115
116
SAMPLE 2:
84
128
79
98
105
95
79
93
99
119
92
112
99
113
128
111
105
104
106
128
134
172
If the samples have equal variances, then p = 0.302, and if the samples have unequal variances, then p = 0.307. So, should I reject or not the NSHT?
Thank you.
These values are not very different and either is much higher than alpha = .05, which would generally mean that you would not reject the null hypothesis.
Charles
Are those cases not paradoxical? I mean when you consider both samples for the equal variance, you do not reject the null hypothesis as well as for the unequal variance. So, it is not significant for both samples which have equal variance or unequal variance. Thank you.
Rei,
If the variances aren’t reasonably similar, then you the test with equal variance will not yield accurate results and so you shouldn’t use it, but instead use the unequal variance version of the test. If the variances are equal, then the results of the equal variance test are accurate and you can expect the result to be quite similar to the unequal variances case.
Charles
Hey Charles,please this is urgent.discuss with example in each case(equal and unequal variance)the estimation of confidence interval mean with an unknown standard deviation and a small sample
.
Godseed,
Figure 4 shows the confidence interval for both the equal and unequal variance cases for a specific example. The calculation is shown on the following webpage:
https://real-statistics.com/students-t-distribution/one-sample-t-test/
This webpage addresses the one sample case. The two sample case is similar and uses the two sample value for the standard error and the difference between the two sample means in place of the difference between the sample mean and the hypothetical mean (often set to zero).
Charles
Hi Charles,
If I am comparing means of say four groups with unequal variances, I will have to go pair wise. So it would be 4C2 combinations.Now I can get different pair with mean significantly different, Is there any way we can claim that this specific group’s mean is significantly different than all others?
Suppose the groups are G1,G2,G3,G4.
Diff of G1,G2 : Significant
Diff of G2,G3: Significant
Diff of G1,G4: not Significant
Diff of G1,,G3: not Significant
……………………………
….all other comb insignificant…
……………….
……………….
Is there any way to reach at conclusion saying mean of G3 is significantly different from all others and G3 is the main culprit?
Many Thanks.
Vaidya,
You may not have one group whose mean is significantly different from the others. It might be that groups A and B are significantly different and all the other pairs are not significantly different. The type of tests that you are referring to are typically dealt with as follow-up tests to ANOVA (like t tests but with more than 2 groups). The typical follow up test is Tukey’s HSD test. Since you have unequal variances you could use the Games-Howell test after ANOVA, although since you have unequal variances you should use Welch’s ANOVA instead of ANOVA as your “omnibus” test. The problem with doing 4C2 separate tests is that this approach inflates the type I error way beyond .05 (what is called experiment-wise error).
All these topics are addressed on the Real Statistics website: just enter the appropriate topic in the Search tab on the right side of the webpage.
Charles
Hi Charles,
What is the actual formula to calculate ‘degree of freedom’ for un-equal variance in t-test.please suggest also why it is different from equal variance?
Ankit,
It is the formula for m on this webpage.
The correction for unequal variances is to make the degrees of freedom smaller.
Charles
Hi Charles,
why is it, that only the nearest integer to m can be used? As you’ve explained the Excel function TTEST used the degrees of freedom unrounded as do other statistics software. So why do you round it?
Jürgen
Jürgen,
I don’t know why Microsoft chose to round off the degrees of freedom. If you don’t want to round off then you can use the Real Statistics T_DIST function instead of Excel’s T.DIST or TDIST function.
Charles
hi please if I am
1. comparing the mean gotten from the length right and left hand, what t-test do I use
2. if I am comparing between the mean length of hand in Africa and the UK what test do I use?
Ernest,
1. Paired t test
2. Two independent t test
In both cases provided the other assumptions are met.
Charles
Can you please interpret the result for me:
t-Test: Two-Sample Assuming Unequal Variances
Variable 1 Variable 2
Mean 12.78571429 12.78571429
Variance 16.33516484 10.7967033
Observations 14 14
Hypothesized Mean Difference 0
df 25
t Stat 0
P(T<=t) one-tail 0.5
t Critical one-tail 1.708140761
P(T<=t) two-tail 1
t Critical two-tail 2.059538553
And
t-Test: Two-Sample Assuming Unequal Variances
Variable 1 Variable 2
Mean 18.64285714 21.71428571
Variance 27.78571429 31.45054945
Observations 14 14
Hypothesized Mean Difference 0
df 26
t Stat -1.493174652
P(T<=t) one-tail 0.073714206
t Critical one-tail 1.70561792
P(T<=t) two-tail 0.147428413
t Critical two-tail 2.055529439
Fritz,
Since the p-value is larger than alpha = .05, you can’t reject the null hypothesis that the two populations have the same mean. Here I am referring to the p-values of 1 and 0.147428413 for the two examples.
Charles
The 1st data is the result of the pretest of the students without the intervention. Variable 1 is the control group while variable 2 is the experimental group. After the intervention, I administered the post test (same question in the pretest) to see if the intervention can yield significant result in improving the scores of the students. Thus data 2 is the result after the intervention is done. Variable 1 is the control with no intervention while variable 2 is the experimental group. Thanks Charles.
When I used the mean percentage score (MPS) between the groups. Variable 1 got 53% while variable 2 got 62%. Can I state on my action research that there was an increase on students’ performance by a statistically significant 8.78% relative to the mean score?
Fritz,
I am not sure what the mean percentage score means in your context, but assuming that the mean for variable 1 is 53% and the mean for variable 2 is 62% and assuming that you have conducted some test (probably the t test as in your previous comments) and obtained a significant result, you can say that variable 2 has as significantly larger mean than variable 1. Although the difference between the sample means is 8.78%, this difference may not be true for the population. You can give a confidence interval that captures the spirit of this conclusion.
Charles
Am I using the correct statistical tool for my study? Thanks for helping me a lot, Charles.
Since I want to know if there is a significant difference between the scores of the two groups. Thanks Charles
Fritz,
Yes, you can use a two sample t test to determine whether there is a significant difference between the mean scores of the two groups, provided the assumptions of the t test are met, esp. independent samples and normality (or least not too far from normality).
Charles
How do we determine degree of freedom for one sample test and two sample test? why?
Sisla,
Regarding the one sample t test, see the following webpage>
https://real-statistics.com/students-t-distribution/t-distribution-basic-concepts/
For the two sample test see the referenced webpage and the following webpage
https://real-statistics.com/students-t-distribution/two-sample-t-test-equal-variances/
Charles
Hi there, This is the prompt, and this is the data. We are typing a results section and need some assistance.
We would like to know whether we can increase the population of an endangered salamander by
adding coarse woody debris to the forest.
We located 40 forest stands and added coarse woody debris to a randomly selected group of 20 of them
and left the other 20 as-is.
two years later, we surveyed for salamanders and computed the population
here are the data, expressed as salamanders per hectare
with CWD as-is
t-Test: Two-Sample Assuming Unequal Variances
Variable 1 Variable 2
Mean 17.375 23.55
Variance 51.26602564 41.68974359
Observations 40 40
Hypothesized Mean Difference 0
df 77
t Stat -4.050687903
P(T<=t) one-tail 6.04193E-05
t Critical one-tail 1.664884537
P(T<=t) two-tail 0.000120839
t Critical two-tail 1.991254395
Sarah,
What null hypothesis are you trying to test?
Charles
Sir, can you please interpret my data for me. I am testing to see if these two mangrove species have equal reflectance wavelength.
Mean 1.915770641 1.597215839
Variance 1.015396402 0.421691398
Observations 1159 1159
Hypothesized Mean Difference 0
df 1978
t Stat 9.046575705
P(T<=t) one-tail 1.72E-19
t Critical one-tail 1.645624349
P(T<=t) two-tail 3.43E-19
t Critical two-tail 1.961164035
Thanks
John,
p = 3.43E-19 is a very small number and so you have a significant result. These means that you have high confidence that yje two mangrove species have different reflectance wavelength.
Charles
Thanks alot sir.
Hello,
For the calculation, where is the u_x and u_y coming from in the data set?
I don’t have the population means, I only have my sample means
Amna,
Excellent question. If your null hypothesis is that the population means are equal, then you don’t need to know u_x and u_y, since from the null hypothesis u_x – u_y = 0.
Charles