Basic Approach
To calculate the power of a one-way ANOVA, we use the Noncentral F distribution F(dfB, dfE, λ) where the noncentrality parameter is
The noncentrality parameter is also equal to f2n where f is the effect size measure described in Effect Size for ANOVA.
Power Example
Example 1: Find the power for the test in Example 2 of One-way ANOVA Basic Concepts.
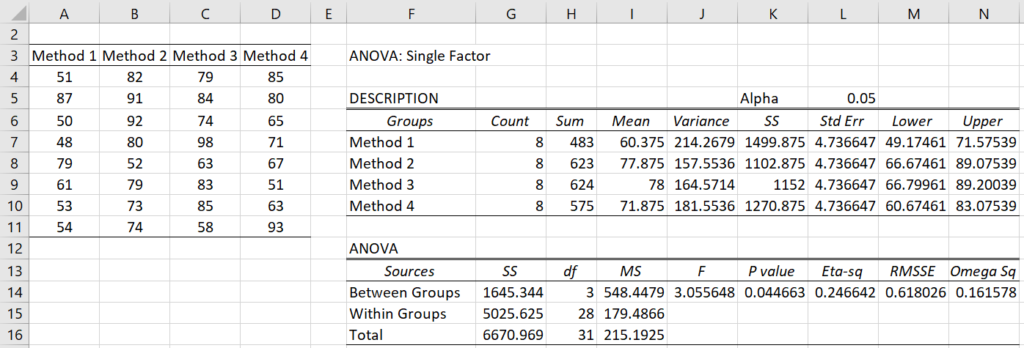
We start by showing the results of the one-way ANOVA using Real Statistics’s data analysis tool in Figure 1.
Figure 1 – One-way ANOVA
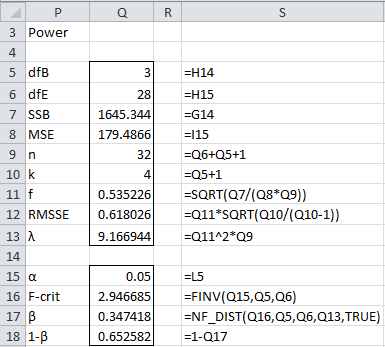
Using the results in Figure 1, we now calculate the power in Figure 2.
Figure 2 – Power of a one-way ANOVA
We see that the power is 65.3%. We can achieve the same result using the first of the following two worksheet functions.
Worksheet Functions
Real Statistics Functions: The Real Statistics Pack supplies the following two functions:
ANOVA1_POWER(f, n, k, type, α, iter, prec) = the power of a one-way ANOVA where n = the sample size. If type = 1 (default) then f = Cohen’s effect size, while if type = 2 then f = the RMSSE effect size. If type = 3 then f = (partial) eta-square effect size, while if type = 0 then f = the noncentrality parameter.
ANOVA1_SIZE(f, k, 1−β, type, α, iter, prec) = the minimum sample size required to obtain power of at least 1−β (default .80) in a one-way ANOVA where type is as for ANOVA1_POWER except that type = 0 is not used.
Here α = significance level (default = .05). The calculation of the infinite sum for the noncentral F distribution stops when the level of precision is less than prec (default 0.000000001) or the number of terms in the infinite sum exceeds iter (default 1,000). See Other Measures of ANOVA Effect Size for the definition of (partial) eta-squared effect size.
For Example 1, ANOVA1_POWER(Q11,Q9,Q10) = .652582, as expected. The same result can be achieved using the formulas
=ANOVA1_POWER(Q12,Q9,Q10,2)
=ANOVA1_POWER(Q13,Q9,Q10,0).
Sample Size Example
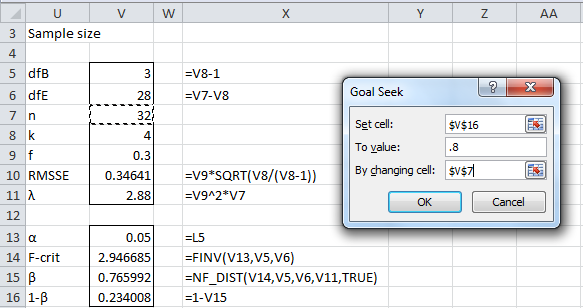
Example 2: How big a sample is required to achieve power of 80% for a one-way ANOVA with 4 groups and a Cohen’s effect size of .3?
We can use Excel’s Goal Seek capability as shown in Figure 3.
Figure 3 – Sample size for one-way ANOVA using Goal Seek
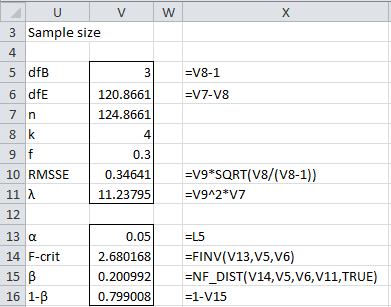
Upon clicking on the OK button in the Goal Seek dialog box, you obtain the results shown in Figure 4.
Figure 4 – Sample size required for a one-way ANOVA
Rounding up we see that a sample size of 125 (cell V7) is required. Actually, this sample size will be just short of 80% power (note that cell V16 is less than 80%). The actual sample size required to achieve 80% is 126.
We achieve the same result by using the Real Statistics formula ANOVA1_SIZE(V9,V8).
Data Analysis Tool
You can also estimate the power or sample size by using Real Statistics’ Statistical Power and Sample Size data analysis tool. Click here for more information about this data analysis tool.
Examples Workbook
Click here to download the Excel workbook with the examples described on this webpage.
References
Faul, F., Erdfelder, E., Buchner, A., & Lang, A. G. (2009). Statistical power analyses using G*Power 3.1: Tests for correlation and regression analyses. Behavior Research Methods, 41, 1149-1160.
http://link.springer.com/article/10.3758/BRM.41.4.1149
STAT (2015) Power and sample size reference manual, release 13
http://www.stata.com/manuals13/pss.pdf


Hey Charles,
I am trying to follow the steps at the top with excel. However, whenever i reach the “=nf_dist()” part, Excel gives me a “name?” error. I have also installed the Real Statistics Resource Pack if that helps.
Thanks!
Hello Akireza,
NF_DIST is a Real Statistics function, and so you shouldn’t get a NAME? error since you have installed Real Statistics.
What do you see when you enter the formula =VER() in any cell?
Charles
I was doing an experiment for a beginner psych course. We tested from people in the class. The following groups included: positive priming, negative priming and a control group. We only had 5 people in each priming group and 4 in the control. The means for each group are pretty much the same. I have no idea what test I should do to.
Hi Carmen,
It depends on the hypotheses that you want to test, but it is likely that you want to use a One-way ANOVA.
Charles
Thanks for this
please can we have a power test for nested anova
Sorry, but I haven’t yet investigated power for nested ANOVA.
Charles
Dr. Zaiontz,
Your site is very valuable and useful.
I work as a civilian for the Army and am developing a spreadsheet to help my folks do an ANOVA. Am enhancing it with VBA. I was able to follow things up to computing Power.
I got all the way to computing F-crit and am stuck on using noncentral F distribution to come up with Beta.
We are very security conscious and my organization will not let us use or install add-ins. My only choice is to code it in VBA. I’m not advanced enough in statistics to convert the formula you have into Excel functions or an algorithm.
Do you have anything that you can share or can you point me to where this is?
Thank you.
Harlan,
I am pleased that you find the website useful.
The calculation of the noncentral F distribution is a little complicated. The code (usually in Fortran) for the implementation can be found on the web. You can also use the free software package G*Power 3.1 to calculate the power of ANOVA.
Charles
What would be the distribution to prepare a lambda table for critical values for “acceptable” power levels, for example, eighty percent and up?
Eric,
For a given alpha (say .05), sample size and power (say 80%), you could use the Real Statistics tools to estimate acceptable lambda values. There would be some trial and error in this calculation (or you could use Goal Seek).
Charles
Why the NF_DIST return #NAME?
I used your example numbers here in my office365
I installed everything as your instruction, solver, real statistics pack.
Thanks.
CJ.
CJ,
It sounds like the Real Statistics software is not yet installed properly; otherwise you shouldn’t see #NAME?
When you enter =VER() into any cell what do you see?
When you press Alt-TI do you see RealStat and Solver on the list of Excel addins with check marks next to them?
Charles
Also me, I got same ERROR even I fixed all issues you motioned.
What sort of error did you get? When did you get the error?
Charles
when I wrote the formula -> =NF_DIST(B106,B95,B96,B103,TRUE)
the result appeared #NAME?
and I had followed all steps you motioned for CJ, but still the result same and I can’t found NF_DIST in my version of Excel (MS Office 365 ProPlus)
Since #NAME? appears, this means that the Real Statistics software has not been installed properly. To confirm, do you get the same error when you enter the formula =VER() in any cell on a spreadsheet?
Charles
Yes I got same error with =VER()
as #NAME?
This means that the Real Statistics software is not yet installed. It is pretty easy to do this. The installation instructions are written on the same webpage from where you downloaded the software.
Charles