Basic Concepts
Conover’s Squared Ranks test is similar to the Fligner-Killeen test in that it is a non-parametric test performed on ranks. Here we assume that we have k independent samples {x1j, …, xnj} randomly selected and want to test the null hypothesis that the population variances of the k groups are equal. (Actually, the sample sizes don’t need to be equal and so n can be replaced by nj).
When the null hypothesis is satisfied, then

where
![]()
![]()
Example
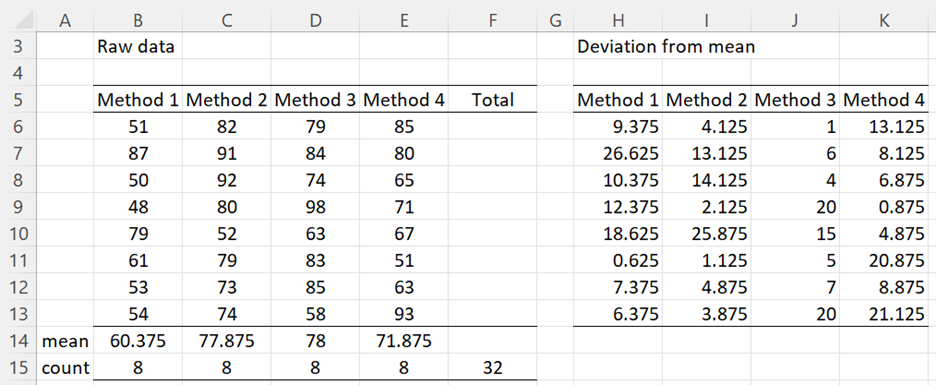
Example 1: Repeat Example 1 of Fligner-Killeen Test using Conover’s Squared Ranks test (data is repeated in range B5:E13 of Figure 1).
Figure 1 – Conover’s Test (part 1)
First, we calculate the means and sample sizes of each method (rows 14 and 15) and then calculate the absolute value of deviations of each data element from the mean for its method. These are shown in range H6:K13.
Ranks and test results
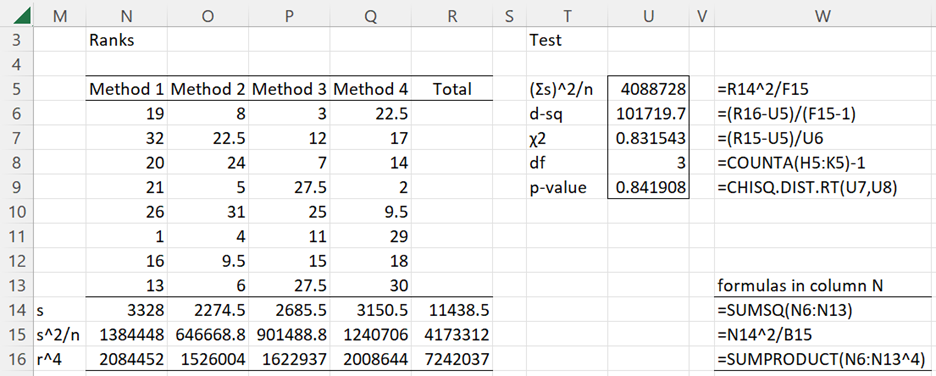
We next calculate the ranks of all the cells in this range as shown in range N6:Q30 of Figure 2. E.g. the rank of 19 in cell N6 is calculated by the formula =RANK.AVG(H6,$H$6:$K$13,1).
We next calculate the values of the remaining cells as described in column W, noting that the values in column R are the sums of the values in columns N through Q: e.g. cell R14 contains =SUM(N14:Q14).
We see that the p-value for the test (cell U9) is .84, which means that we will accept the homogeneity of variance hypothesis for the original data.
Figure 2 – Conover’s Test (part 2)
Worksheet Function
Real Statistics Function: The Real Statistics Resource Pack provides the following function.
CONTEST(R1) = p-value of the Conover test on the data in range R1.
For Example 1, CONTEST(B4:E11) = 0.8419.
Examples Workbook
Click here to download the Excel workbook with the examples described on this webpage.
References
NIST (2015) Squared ranks
http://www.itl.nist.gov/div898/software/dataplot/refman1/auxillar/squarank.htm
Conover, W. J. (1999) Practical nonparametric statistics, 3rd Ed. Wiley

