Basic Concepts
The Harrell-Davis quantile is an approach for providing a more robust estimate of percentiles and related measures such as the median. These can be useful, for example, with bimodal data. We can use the Harrell-Davis median instead of the ordinary median when identifying outliers from such data. In particular, we can use the Harrell-Davis version of the MAD and Double MAD, expanding on the approaches for identifying outliers described in Identifying Outliers using the MAD and Double MAD.
Example
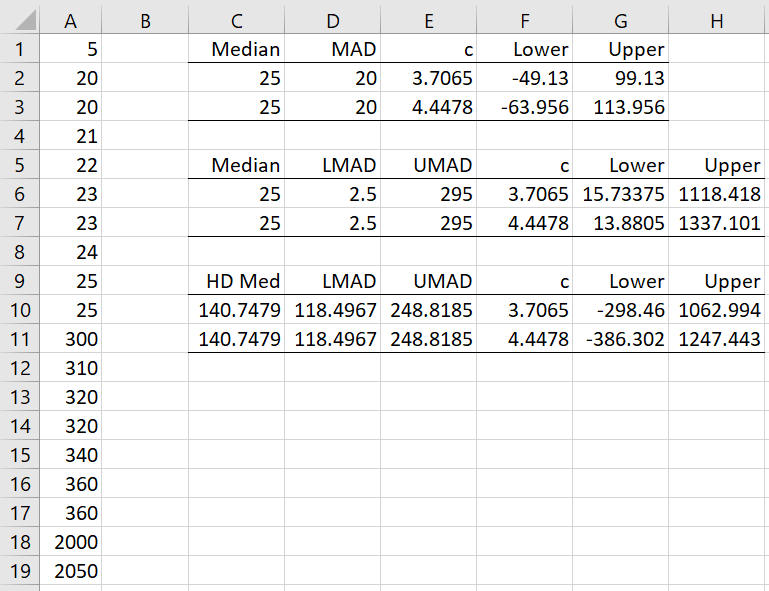
Example 1: Find the Harrell-Davis median for the data in column A of Figure 1. Determine the outliers for this data.
Figure 1 – Harrell-Davis approach
Based on the usual MAD approach, 300, 310, 320 (twice), 340, and 360 (twice) are all considered to be outliers. But since the data is skewed it is better to use the Double MAD approach, which yields outliers of 5, 200, and 2050.
Since the data is bimodal, we use the Double MAD approach based on the Harrell-Davis median. The Harrell-Davis median is shown in cell C10 using the formula =HD_QUANTILE(A1:A19,.5). Note that although the ordinary median is 25 (as shown in cell C6), the Harrell-Davis median is 140.7479 (cell C10). This better reflects the weight of the larger data values.
The Harrell-Davis DoubleMAD approach, as shown in range C9:H11, shows that only 2000 and 2050 are potential outliers, removing 5. E.g. cell D10 contains the formula =DoubleMAD(A1:A19,TRUE,TRUE).
Examples Workbook
Click here to download the Excel workbook with the examples described on this webpage.
Reference
Akinshin, A. (2020) DoubleMAD outlier detector based on the Harrell-Davis quantile estimator
https://aakinshin.net/posts/harrell-davis-double-mad-outlier-detector/#Rosenmai2013
