Basic Concepts
We can actually calculate an exact distribution for the sample correlation coefficient when the population correlation coefficient is ρ even when ρ ≠ 0. The cdf for this distribution is
where
![]()
and dk is defined recursively by
![]()
and
Worksheet Functions
Real Statistics Functions: The following functions are provided in the Real Statistics Resource Pack.
CorrETest(r, size, rho, tails) = the p-value of the one sample exact test of the correlation coefficient where rho is the expected population correlation coefficient and r is the observed correlation coefficient based on a sample of the stated size.
CorrETest(R1, R2, rho, tails) = CorrETest(r, size, rho, tails) where r = CORREL(R1, R2) and n = the common sample size, i.e. the number of pairs from R1 and R2 for which both pair members contain numeric data; i.e. COUNTPair(R1, R2, FALSE).
CorrelETest(r, size, rho, lab, alpha, tails) – array function similar to CorrETest(r, size, rho, tails), except that a 1−alpha confidence interval is also output
CorrelETest(R1, R2, rho, lab, alpha, tails) – array function similar to CorrETest(R1, R2, rho, tails), except that a 1−alpha confidence interval is also output
If tails = 2 (default) a two-tailed test is employed, while if tails = 1 a one-tailed test is employed. If lab = TRUE then a column of labels is appended to the output.
Example
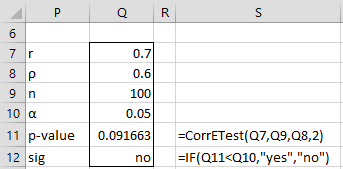
We can repeat the test from Example 1 of Correlation Testing via Fisher Transformation using the exact distribution, as shown in Figure 1.
Figure 1 – Exact Test
We see that the p-value = .0917, which is similar to the p-value of .0863 we obtain using the Fisher transformation.
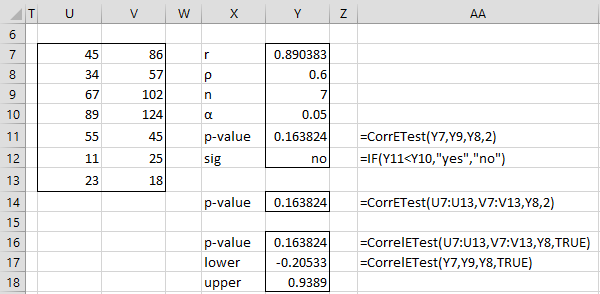
Example 1: Use the Correlation Exact Test to calculate a 95% confidence interval of the correlation coefficient for the data in range U7:V13 of Figure 2 based on rho = .6.
The calculation is shown on the right side of Figure 2.
Figure 2 – Exact Test for Confidence Interval
Observation
When ρ is zero, the p-value obtained from the exact test will be identical to that obtained using the t-test. Thus the p-value for Example 1 of Correlation Testing via t-Test will again be .002822.
Examples Workbook
Click here to download the Excel workbook with the examples described on this webpage.
References
Barabesi, L., Greco, L. (2001) A note on the exact computation of the Student t, Snedecor F, and sample correlation coefficient distribution functions. Journal of the Royal Statistical Society. Series D (The Statistician)
https://www.jstor.org/stable/3650394
Statistica Help (2024) Example 9: Exact tests and confidence intervals for the correlation coefficient
https://docs.tibco.com/pub/stat/14.1.0/doc/html/UserGuide/_shared/example-9-exact-tests-and-confidence-intervals-for-the-correlation-coeff.htm?TocPath=Statistica%20Help%7CStatistica%20Examples%7CPower%20Analysis%7C_____9


Dear Charles
Do you have a reference for the distribution you give at the top of this page ?
Yours truly
Hello Fred,
I have just added the reference to this webpage.
Charles