In Correlation Basic Concepts we define the correlation coefficient, which measures the size of the linear association between two variables. We now extend this definition to the situation where there are more than two variables.
Multiple Correlation Coefficient
Definition 1: Given variables x, y, and z, we define the multiple correlation coefficient

where rxz, ryz, rxy are as defined in Definition 2 of Basic Concepts of Correlation. Here x and y are viewed as the independent variables and z is the dependent variable.
Coefficient of Determination
We also define the multiple coefficient of determination to be the square of the multiple correlation coefficient.
Often the subscripts are dropped and the multiple correlation coefficient and multiple coefficient of determination are written simply as R and R2 respectively. These definitions may also be expanded to more than two independent variables. With just one independent variable the multiple correlation coefficient is simply r.
Unfortunately, R is not an unbiased estimate of the population multiple correlation coefficient, which is evident for small samples. A relatively unbiased version of R is given by R adjusted.
Definition 2: If R is Rz,xy as defined above (or similarly for more variables) then the adjusted multiple coefficient of determination is
![]()
where k = the number of independent variables and n = the number of data elements in the sample for z (which should be the same as the samples for x and y).
Data Analysis Tools
Excel Data Analysis Tools: In addition to the various correlation functions described elsewhere, Excel provides the Covariance and Correlation data analysis tools. The Covariance tool calculates the pairwise population covariances for all the variables in the data set. Similarly, the Correlation tool calculates the various correlation coefficients as described in the following example.
Example 1: We expand the data in Example 2 of Correlation Testing via the t Test to include a number of other statistics. The data for the first few states are displayed in Figure 1.
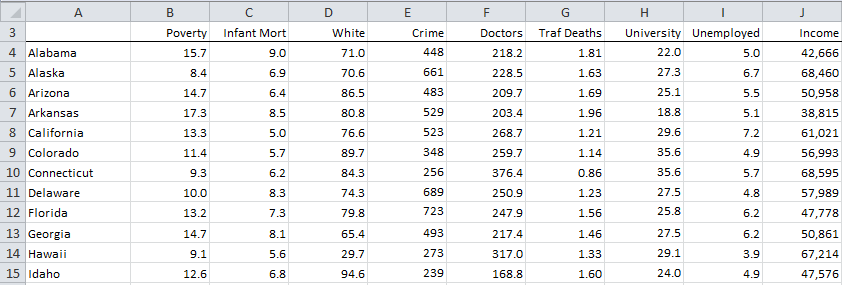
Figure 1 – Data for Example 1
Using Excel’s Correlation data analysis tool we can compute the pairwise correlation coefficients for the various variables in the table in Figure 1. The results are shown in Figure 2.
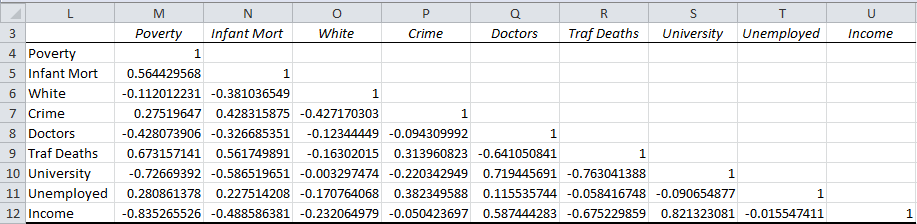
Figure 2 – Correlation coefficients for data in Example 1
We can also single out the first three variables, poverty, infant mortality, and white (i.e. the percentage of the population that is white) and calculate the multiple correlation coefficients, assuming poverty is the dependent variable, as defined in Definitions 1 and 2. We use the data in Figure 2 to obtain the values 


![]()
![]()
Partial and Semi-Partial Correlation
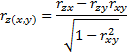
Definition 3: Given x, y, and z as in Definition 1, the partial correlation of x and z holding y constant is defined as follows:

In the semi-partial correlation, the correlation between x and y is eliminated, but not the correlation between x and z and y and z:
Causation
Suppose we look at the relationship between GPA (grade point average) and Salary 5 years after graduation and discover there is a high correlation between these two variables. As has been mentioned elsewhere, this is not to say that doing well in school causes a person to get a higher salary. In fact, it is entirely possible that there is a third variable, say IQ, that correlates well with both GPA and Salary (although this would not necessarily imply that IQ is the cause of the higher GPA and higher salary).
In this case, it is possible that the correlation between GPA and Salary is a consequence of the correlation between IQ and GPA and between IQ and Salary. To test this we need to determine the correlation between GPA and Salary eliminating the influence of IQ from both variables, i.e. the partial correlation }")
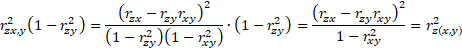
Property
Property 1:
![]()
![]()
Proof: The first assertion follows since
![]()
![]()
The second assertion follows since:
Example 2: Calculate 
}")
![]()
![]()
We can see that Property 1 holds for this data since
![]()
![]()
Partitioning Variance
Since the coefficient of determination is a measure of the portion of variance attributable to the variables involved, we can look at the meaning of the concepts defined above using the following Venn diagram, where the rectangular represents the total variance of the poverty variable.

Figure 3 – Breakdown of variance for poverty
Using the data from Example 1, we can calculate the breakdown of the variance for poverty in Figure 4:
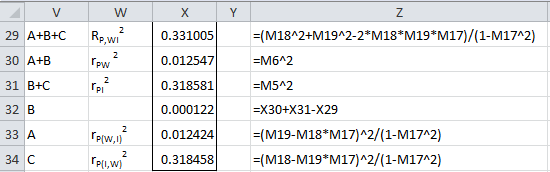
Figure 4 – Breakdown of variance for poverty continued
Note that we can calculate B in a number of ways: (A + B – A, (B + C) – C, (A + B + C) – (A + C), etc., and get the same answer in each case. Also note that
![]()
![]()
where D = 1 – (A + B + C).
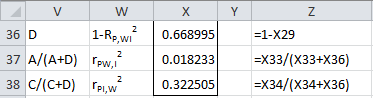
Figure 5 – Breakdown of variance for poverty continued
Property 2: From Property 1, it follows that:
![]()
If the independent variables are mutually independent, this reduces to
![]()
Worksheet Functions
Real Statistics Functions: The Real Statistics Resource Pack contains the following functions where the samples for z, x, and y are contained in the arrays or ranges R, R1, and R2 respectively.
CORREL_ADJ(R1, R2) = adjusted correlation coefficient for the data sets defined by ranges R1 and R2
MCORREL(R, R1, R2) = multiple correlation of dependent variable z with x and y
PART_CORREL(R, R1, R2) = partial correlation rzx,y of variables z and x holding y constant
SEMIPART_CORREL(R, R1, R2) = semi-partial correlation rz(x,y)
Multiple Correlation for more than 3 variables
Definition 1 defines the multiple correlation coefficient Rz,xy and the corresponding multiple coefficient of determination for three variables x, y, and z. We can extend these definitions to more than three variables as described in Advanced Multiple Correlation.
E.g. if R1 is an m × n array containing the data for n variables then the Real Statistics function RSquare(R1, k) calculates the multiple coefficient of determination for the kth variable with respect to the other variables in R1. The multiple correlation coefficient for the kth variable with respect to the other variables in R1 can then be calculated by the formula =SQRT(RSquare(R1, k)).
Thus if R1, R2, and R3 are the three columns of the m × 3 data array or range R, with R1 and R2 containing the samples for the independent variables x and y and R3 containing the sample data for dependent variable z, then =MCORREL(R3, R1, R2) yields the same result as =SQRT(RSquare(R, 3)).
Similarly, the definition of the partial correlation coefficient (Definition 3) can be extended to more than three variables as described in Advanced Multiple Correlation.
Examples Workbook
Click here to download the Excel workbook with the examples described on this webpage.
References
Howell, D. C. (2010) Confidence intervals on effect size
https://www.uvm.edu/~statdhtx/methods8/Supplements/MISC/Confidence%20Intervals%20on%20Effect%20Size.pdf
Schmuller, J. (2009) Statistical analysis with Excel for dummies. Wiley
https://thuvienso.dau.edu.vn:88/bitstream/DHKTDN/6875/1/6213.Statistical%20analysis%20with%20excel%20for%20dummies%20%282nd%20ed%29.pdf
Hi Charles Zaiontz
Thank you for providing valuable information related to the multiple-correlation.
From Experiment-1, Figure-2, there are a total of 36 coefficients present. How to combine all these coefficients results.
For my work, I need to combine multiple coefficients (multiple coefficients areas like your figure-2) results.
I would be grateful if you could help on this topic.
Thank you for your time and consideration.
Hi Venkata,
If you choose one variable as the dependent variable (with the others as the independent variable), you can calculate one correlation coefficient. For three variables this described towards the bottom of this webpage (especially by using the MCORREL function). For 2 or more variables, you can use the square root of the result from the RSquare function or, more simply, use the correlation coefficient which results from linear regression.
Charles
Hi, I am working on a research artcile in which i have used 13 variables. I wanted identify the relationship between each variables for which I used the Excel ‘Correl’ function.
Most of the values, i have got, are around +/- 0.9 and few values are even +/- 1.0.
What do you suggest, shall i go with the results or do you think the values are too high.
Thanks.
These are high values, but they can be representative of the situation. Do you have reason to question the accuracy of these results_
Charles
How about
1hr 2hr 3hr 4hr 5hr
0.1 N 0 0.375 0.545 0.655 0.688
0.5N 0.833 0.922 0.954 0.962 0.965
1.0N 0.998 0.998 0.999 0.999 0.999
4.0N 0.998 0.999 0.999 0.999 0.999
What is your question?
Charles
Hi,
I have a number of variables (~100) in a column, that change over time as seen below.
How can I do a correlation to go all variables vs all variables, to see which ones behave similarly?
Would it be a way of determining patterns within variables to generate behaviour profiles (ie: profile 1: gradually increasing over time, profile 2: peak in the middle,…)
Thanks
Time 0 Time 1 Time 2
Variable 1 23 36 24
Variable2 15 2 3
variable 3 27 42 30
…
You can use the Real Statistics CORR function to accomplish this.
Charles
Hi Charles,
Thank you for this guide. I’m having troubles determining the proper statistical tests and methods I have to use on my data. I have 7 variables- for example, my IV is a and DV is b, and I want to control other variables c, d, e and f. However, not all the other variables are correlated to both, a and b (some are correlated to only a, and some to only b). Hence, would a partial correlation still work here? And is there a correction I need to do for the number of correlations this will create?
Hello Zara,
What hypotheses are you trying to test?
Charles
Thank you for your reply!
My hypotheses are:
as ‘a’ increases, ‘b’ will decrease (while controlling for c, d, e and f)
as ‘c’ increases, ‘b’ will decrease (while controlling for a, d, e and f)
Hello Zara,
For “as ‘a’ increases, ‘b’ will decrease (while controlling for c, d, e and f)”, you can perform linear regression with ‘b’ as the dependent variable and the others as the independent variables. You will then look to see whether the p-value for the ‘a’ coefficient is significant and the coefficient itself is negative. The approach is similar for the test on ‘c’, using the same regression.
Charles
I was considering the regression, however some of my variables are not normally distributed.
Also, some of the variables are correlated with each other, which would violate the assumption of collinearity.
Hence why I thought doing partial correlations (using Spearman’s) would be the right step.
Hello Zara,
The independent variables can be correlated (although not at 1 or -1). Normality is a technically a requirement but most tests are pretty robust to violations of normality that are not too severe.
Charles
Hi Charles,
My supervisor seemed insistent on using partial correlations, rather than regression, for the reasons I mentioned above. I’m not sure if I should go against that and switch the test so late. Also, it’s because I want to see the ‘true’ effect of ‘a’ and ‘c’ on ‘b’ (by removing the effects of the other variables), and not just how much variance is caused by ‘a’ and ‘c’. Does this make sense?
You can use the partial correlation as you suggested in an earlier comment.
Charles
Hi,
I am doing an assignment for an S&C masters.
I first have to calculate the relationship between bench press improvement and session intensity, which I did using the Excel ‘Correl’ function
I then have to see if there is an effect of the lifters’ weights on this relationship.
What do you suggest is the best way to tackle this question and is there a way in Excel of SPSS to do this.
Any help is greatly appreciated.
Thanks
Hi Jim,
Can you explain what you mean by “an effect of the lifters’ weights on this relationship”?
Charles
Hi Charles,
Thanks for your reply.
I am a little unsure myself with the wording, but my grasp of it is that I need to calculate the correlation between the weight of the people and the ‘relationship between the their bench press improvement and session volume’. In essence, it reads as though I have to find a 3-way correlation or else the correlation between a set of values and an already correlated 2-way value.
Does that make sense to you?
Thanks,
Fran.
Hello Fran,
In this case, you can use the MCORREL function to calculate the 3-way correlation (actually one variable with the other two). This can also be calculated by performing a regression of the two variables on the third.
Charles
I’m trying to do something much as you have done. I’m using geographical locations, such as states. Then using variables similar to yours, race, age, employment, education, and many more, to see what the correlation to a result is. I’m testing many different versions: insured vs uninsured, income ranges, etc. The big difference is rather than look at ALL the geographic ranges together, I need to see the correlations for each variable AND each location. I can’t figure out how to do this with a reasonable number of worksheets – if it even can be done. Ultimately, I’d see which of the couple dozen variables correlated the most in individual locations and look for trends within those based on larger geographic regions. Thanks for any insight.
Hello Andrew,
If you are only comparing pairs of variables, you can use Excel’s Correlation data analysis tool or the Real Statistics Matrix data analysis tool (Correlation option).
Charles
Hi,
I am working on a project currently and I am stuck as to how I can accomplish exactly what I am looking for. From the data you provided above, what I would be looking for is correlation between two of the states , for example how similar Alabama and Alaska are given the different metrics that vary in scale. Currently I am using the Pearson Correlation Coefficient but was wondering if there would be any better way to do it.
Thanks
Jordan,
Based on the information that you have provided, Pearson’s correlation may indeed be the right statistic to use.
Charles
Is the same Multiple Correlation Coefficient still applicable when Z moderates the correlation bethween X and Y (interaction effects)?
Hello Emil,
If x is the independent variable, z is the moderating variable and y is the dependent variable, then the Multiple Correlation Coefficient (as calculated by MCORREL) is still correct. This is just the correlation coefficient that results from regressing y on x and z.
Charles
What I don’t understand is: How can both variables influence the third variable, if 2 of the variables moderates the correlaion bethween each other and the third variable? Don’t they overlap? Do I have to combine both correlations? If the correlation bethween X and Z = 0.6, and Y and Z =0.55, and that X moderates the correlation bethween Y abd Z, and vice versa, and that there’s no correlation bethween X and Y, do I then have to add the coefficients of determination bethween both correlations (0.6*0.6=0,36, 0.55*0.55=0.3 – 0,36+0.3 = 0.66)? Or is the influence of the variable with a correlation of 0.6 already overlapped/included in the correlation of the variable with a correlation of 0.55?
Hello Emil,
Perhaps one of the following webpages will help:
http://davidakenny.net/cm/moderation.htm
https://gradquant.ucr.edu/wp-content/uploads/2017/02/03_moderation.pdf
https://en.wikipedia.org/wiki/Moderation_(statistics)
Charles
I’ve found a few articles that contradicts what you said with that the Multiple Correlation Coefficient is still correct. Which is true – what you said or what is written in the articles below?
https://books.google.dk/books?hl=da&lr=&id=Q9rSAwAAQBAJ&oi=fnd&pg=PA111&ots=2e3whreIax&sig=En0Dv4x95G6lc5rzYWg7UTeBmlA&redir_esc=y#v=onepage&q&f=false
https://link.springer.com/chapter/10.1007/978-0-585-25657-3_25
In one of the articles it says:
In multiple regression analysis, we make the initial assumption that the effects of the independent variables on the dependent variable are additive. In short, we assume that the dependent variable can be predicted most accurately by a linear function of the independent variables. However, the effects of independent variables on a dependent variable are not always additive. We refer to the presence of nonadditive effects as interaction.
I’ve read (according to several different sources), that when there is an interaction effect/a moderating variable, then the model is non-additive. In other words: Multiple Correlation shouldn’t be applicable when 2 of the variables moderates each others effects on the third variable.
https://link.springer.com/chapter/10.1007/978-0-585-25657-3_25
Hello Emil,
From the Abstract of the article you sent me, it appears that the interaction effect is not additive. In this case you can’t simply use linear regression. Since I don’t have access to the full article, I can’t say what the author says should be done to address this situation.
Charles
My question is: How can the Multiple Correlation Coefficient still be correct, if interaction effects/moderating variables results in non-additivity in multiple regression?
See my previous response.
Charles
Hello Charles,
Thank you for your examples. I work in the field of hydrology, I am not very good at stat. I am trying to develop a relationship, for my research, between flood “travel time” within at some selected locations (6 no of sample datasets from different watershed basins/catchment areas). The travel time depends on numerous climatic, topographic and hydraulic parameters; as many as 12, I can say.
1. I want to screen down those 12 parameters to 3-5 depending upon their influence on travel time; and
2. Another objective is to develop an empirical relationship (linear/non-linear multiple regression) based on collected datasets from 6 watershed basins.
Can you please guide me on how to achieve these two objectives; any reference material, examples, and software that can be used, etc…
Hello Tayyab,
Sounds like interesting research. If I understand correctly, you have a sample of 6. This is quite a small number, especially for the number of factors that you plan to evaluate. This is probably the main limitation to your study, at least from a statistical point of view, if you hope to generalize your results to other watershed basin/catchment areas.
1. You can use Factor Analysis to reduce the # of parameters. Alternatively, you can use all of them in the regression and eliminate the ones that are not significant or combine parameters that produce collinearity. Again, this second approach won’t be possible if the number of sample elements is less than the number of parameters (in which case regression can’t be used). These techniques are described on the Real Statistics website.
2. You can use linear regression or non-linear regression. These techniques are described on the Real Statistics website. You can graph your data to see which approach fits the data the best.
Charles
Hello Charles,
thank you for your example. I would like to know if you have neglected the states in your correlation matrix? It isn’t a multiple correlation that is better and in this case you need Xlsstat?
Hello Lili,
The state labels should not be included in the correlation matrix. I don’t understand the problem that you are referring to.
Charles
thank you for your answer.
It seems to me that you correlate the different parameters in first line of table in a simple correlation in excel but if you have to make a correlation between the parameters in first line and the different states, you should not use xlsstat for a multiple correlation?
Can we do a correlation matrix of multiple parameters in excel?
Lili,
If you first take the transpose of the input data and then use Excel’s Correlation data analysis tool, I believe that you will get the result that you are looking for. You can also get this result by using the Real Statistics array formula =COV(TRANSPOSE(R1)) where R1 contains the data (without the headings).
Charles
Hello Charles, I’m looking for an equation to compute a multiple correlation for 3 independent variables to match 2 patterns of textures (e.g. using its histograms’ correlations on R,G,B)
Thank you for any advice, Grigori
Grigori,
Sorry, but I don’t understand your comment. Can you explain further?
Charles
Goodmorning,
I want to determain the correlation of the following formula:
y= -0,014697911 + 0,98012104X + 0,00048497. The data for an data analysis is:
y= 0 & 14,31 & 25,12 & 37,55
X= 0 & 14,5680 & 25,2665 & 37,6406
X^2= Square of X
I created a polynomial quadratic line, or in other words a second order line, but i need help to calculate the correlation of this line with formulas in excel.
Could someone pleas help me?
Jeroen,
On the regression output you should see a Multiple R entry. This is the correlation value. When I run the Real Statistics Polynomial Regression data analysis tool, I see that the correlation is .999995. This corresponds to a regression line of y= -0.01454 + 0.97997X + 0.0004916X^2.
Charles
Hi Charles,
What formula should I use when our study is all about determining the effects of online computer games to the academic performance of students? Whether it positive, negative or no effects at all.
Marin,
Please describe the experiment that you are using to determinine the effects of online computer games to the academic performance of students.
Charles
Hi Charles,
I am confused for which method to use for my thesis. Not goid at stats. Actually, I am working on teachers divided into government and private school teachers and both are further divided into males and females. Now, I have 3 scales to apply b psychological capital, organizational commitment and life satisfaction. I want to see whether psychological capital and its 4 dimensions correlates with OC and LS. Now, If I am taking product moment correlation for each dimension with each classification (like dimension 1 with oc for govt. Male, dimension 1 with oc for govt. Female… Nd so on it is resulting into 40 hypotheses. Nd it is correlation only. If I will try to make prediction too then my hypotheses will increase making study difficult to explain each hypothesis individually.
Please help me to tackle this situation.
Thank you in advance 🙂
Vinz,
40 hypotheses is a lot. I hope that your sample is very large. The big issue is the inflation of type I error. I will be adding some new capabilities in the next release of the Real Statistics software which deals with this issue better. This release should be available within about one week.
Charles
Hi Charles,
I am currently working on a research proposal. I want to run correlations to see if there is a positive, negative, or no relationship at all. My hypothesis is that there is a positive relationship, but I don’t know how to run correlations. I am focusing on a specific disease and whether that disease leads to nutrition problems and socialization difficulties, resulting in hindrance in language development of children. How can I run correlations of these. Please help!
Nanc,
It depends on what you mean by “run correlations”. To calculate a correlation between two samples, you can use Excel’s CORREL function. If you have three samples, you can use the Real Statistics MCORREL function. With more than 3 samples you can use Real Statistic’s RSquare function or the Regression data analysis tool (the correlation is one of the outputs).
If you want to do hypothesis testing on the correlation see the following webpage:
https://real-statistics.com/correlation/
Charles
Hi,
Thanks for the article.
The formula for 2 independent variables is great – but what would be the general case for N independent variables?
The problem I am working on is influenced by up to 5 factors.
Thanks!
John,
This is described towards the bottom of the webpage starting with:
Observation: Definition 1 defines the multiple correlation coefficient R_z,xy and corresponding multiple coefficient of determination for three variables x, y and z. These definitions can be extended to more than three variables as described in Advanced Multiple Correlation.
Charles
Dear Sir, we have two independent series X and Y i.e. Cov(X,Y)=0. but if i want to create 70% correlation between X and Y it can be easily created. Now my question is that if we have three variables X Y and Z which are also uncorrelated so i want to create 70% correlation between X and Y given Z then how it is possible? Cov(X,Y/Z)=0.70?
Rizwan,
Please define what you mean by Cov(X,Y/Z). Is this what I am calculating via MCORREL(Z,X,Y)?
Charles
Really Informative. Thanks a ton.
Hello sir,
My question is
A computer found for a given set of values of x, y and z,Rxy=0.4,Ryz=0.5 and Rxz=0.3.
Explain whether these computations is said to be free from errors.
Avneet,
It is possible to find values for x, y and z which produce these correlations. For example:
1.05266513 0.004010622 9.88013171
1.407501305 5.672286079 -0.04035672
0.045398597 6.472694927 9.656375486
4.800803653 9.01360524 0.040589852
I used Solver to find these values.
Charles
Hi Charles !
Thank you for all the helpful information on this page. Very helpful for someone like me who is having a hard time with statistics.
I hope you can help me, I am currently making my thesis and I don’t know what statistical treatment I will use. My study is about Emotional Intelligence, Resilience and Coping Strategies and I wanted to correlate it to the wellbeing of an individual. I am using survey tools for all the variables. Thank you
Sarah,
Based on the limited information you provided, all I can say is that it is likely that you can get the correlation value that you are looking for by performing multiple linear regression and using the correlation statistic that is reported.
Charles
Thank you Charles
Hi, Charles!
I want to let you know that I appreciate all your work. It’s very helpful for students like me. I just have a small problem which I hope you can help me with.
I keep getting this error message saying
Compile error in hidden module: Look up. This error commonly occurs when the code is incompatible with the version, platform, or architecture of this application.
every time I open excel since I loaded the realstat.xlam. I have used it before with no problem but recently, that message is always popping up. Can you please enlighten me what the problem is?
Kristel,
The usual reason for this message is that Solver has not been installed, but since Real Statistics worked in the past, perhaps this is not the problem. I suggest that you look at the Troubleshooting section on the following webpage:
https://real-statistics.com/free-download/real-statistics-resource-pack/
Charles
Charles,
Thank you for taking the time to read my post. I know but that correlation is being driven by only 3 of the 51 variables. when I removed CA r= .846; remove CA and TX r=.757; finally, remove CA, TX and FL r=.637. There is still evidence of a moderately strong to strong positive linear correlation but a far cry from a .9 . I don’t want to over represent the correlation and compromise the validity of my data. I am just concerned that if I use the per capita measurement for violent crime I am introducing population as a variable. I would actually be comparing the ratio of violent crime to population, to the ratio of police killings to population. This may be a basic question that deserves nothing more than a basic answer. Like I said before I have never taken a statistics class or worked with statistics professionally; mathematically I peaked at algebra so I wont be offended by a simplistic answer. Thank you for your time in advance.
V/R
Damon
Damon,
If you like can calculate a multiple correlation coefficient using all 51 variables. You don’t need to be restricted to only 3 variables.
This topic is covered in the Multiple Regression section: https://real-statistics.com/multiple-regression/. Using multiple regression, you can determine which variables to retain in your model, which variables have the most weight, etc.
In the example you gave with three variables, you might want to retain all the variables, although the Multiple Regression techniques will help you to determine whether this is necessary.
Charles
Charles,
I appreciate the recommendation and I am contemplating the option, but the time for completing this study is fast approaching. I think for now I will go forward with the data and correlations that I have and simply identify the situation and use population as a control variable. I will state that my correlations are based only on states that have populations of less than <20,000,000 people and why. If I manage to complete the paper with some time remaining I will try and teach myself how to do a multiple correlation. I knowledge of statistics is limited what I have learned from various online sources. If I do attempt a multiple correlation I will let you know how well your tutorials aided me in the process. Thank you for taking the time to assist me on this study.
V/R
Damon
Charles,
I have never actually taken a statistics class but am trying to calculate the correlation coefficient for two variables. I don’t have a problem with the the equation but my r value is .9 . I have determined that this is caused by an excessively high standard deviation for both my x and y variables. I am attempting to show the correlation between violent crime and individuals killed by police for all 50 states and DC. The three highest states have values of 166,883, 113, 227, 93,626, but 45 of the states have values under 40,000. The result generated a standard deviation of over 30,000 placing 39 of the 51 variable for x withing the Sx. I am concerned that per capita measurements will dilute the value. What would be my best option to produce the most accurate correlation coefficient value? Do I consider the top three states to be outliers and eliminate them or use the per capita values? If I use the per capita value for the violent crimes would I also need to apply that to my individuals killed data? Thank you in advance for your time and assistance.
Very Respectfully
Damon
Damon,
What is the problem with having a value of r = .9? This shows that there is a high correlation.
Charles
Hi Charles,
I think you made a typo in your calculations for the adjusted R^2 value.
sqrt(1-(1-0.331)*49/47) = 0.55 and not 0.425. In your Excel spreadsheet k = 9 and not 2, as it should be for this case.
Best wishes,
Florian
Florian,
The example explicitly refers to only two of these variables, namely infant mortality and white, with poverty as the dependent variable. Thus k = 2.
Charles
Hi Charles,
Yes, I got that. Therefore the value in your text should be adjusted since right now the equation is not correct.
sqrt(1-(1-0.331)*49/(50 -2 – 1) ) = 0.55 and in the text above it says sqrt(1-(1-0.331)*49/(50 – 2 – 1)) = 0.425, which is not correct.
sqrt(1-(1-0.331)*49/(50 – 9 – 1)) is 0.425 .
Best wishes,
Florian
Florian,
Yes, you are correct. In fact, there is another error as well. The calculation of Adjusted R-square should not use a square root. Adjusted R would use a square root.
I have now corrected the webpage. Thanks for your help in identifying this error and improving the accuracy of the website.
Charles
Hi! I have to write a sentence based on 3 variables correlation , I don’t really understand how to put all of the data into a 1-2 sentence. Can you help me? thank you
Ines,
Are you asking how to report the results of the correlation between three variables?
Is this for a publication or a school assignment? Publications have their own guidelines for these sorts of things.
Charles
Hi Charles,
Please help me if you have time! I’m wokring on a project to find if there is a correlation between influence of advertisements on purchasing habits. I have collected data (age, gender, occupation, no. of social media accounts, no. of purchases) and scale of percieved influence from 1 to 5 (1 being totally disagree to 5 being strongly agree). What can I do to make sense of these datas?
Hi Charles,
I need to find a correlation between the Levels of intelligence and aggression to black humor. Could you please help me know how to compute this?
To be specific, I will compute for the relationship of black humor to intelligence, black humor to aggression,and intelligence and aggression.
Francis,
To compute the correlation of black humor to intelligence use Excel’s CORREL function
To compute the correlation of black humor to intelligence and aggression use the Real Statistics MCORREL function or look at the correlation value when you use Excel’s Regression data analysis tool where you use intelligence and aggression as the independent variables and black humor as the dependent variable.
Charles
What is the statistic to use the tests regarding multiple correlation coefficient with full derivation of this statistic….??
Sorry, but I don’t understand your question.
Charles
Hi Charles,
I need to find a correlation between capital expenditure amount and tenure of the capital expenditure to the length of payback period. Could you please let me know how we do this?
Thanks
Khezmo,
You can use the MCORREL function as described on this webpage or simply perform linear regression and use the multiple correlation output.
Charles
Hi,
I work for the government in the engineering and environmental regulatory industry for oil and gas. I am currently working on a project to analyze air quality data form an air shed. parameters monitored are windspeed, temp, wind direction, h2s, s02, methane hydrocarbons and non methane hydrocarbon concentrations. A third party has been contracted to produce annual reports however the reports produced contain only windroses, bar graphs and some pretty basic statistical methods; albeit powerful because they get the point across and are easy to undertand. However, I need to come up with a statistical method to analyze the data to determine
1. on 0.05 significance level, alpha, if the average concentration of each pollutions is increasing yearly
2. A statistical analysis method to pin point sources of said pollutants during spike in readings. For example oil and gas pollutants will have a certain signature or pollution components e.g high methane, h2s and so2 reading however, bush burning activities will have a lot of particulates, c02 and nox pollutants. My idea was to couple two pollutants or parameters and see if there is a correlation and determine a linear regression equation. if I can establish that there is correlation between 2 or more pollutants I can assume that they were releases either from the same source or released at the same time. is there a better way to approach this and which test will suffice? A t test, F test or ANOVA?
Mike,
To better understand the scenario that you are describing and the types of analyses that you want to perform requires some discussion. This looks to be a consulting engagement.
Charles
Hi Mike,
It is not a consulting engagement (on my part), however it is a side project that I am working on as I love my job so much and I am very passionate about statistical analysis… I am a young engineer eager to make a difference and a name for my self.
Please what is your email address? I can provide more info via email. Thanks for your time.
Mike,
You can get my email address at Contact Us
Charles
Dear Mike,
Please contact me for your point 2. above.
Pierre Lafaye de Micheaux
Senior Lecturer, UNSW Sydney, Australia
hye Charles, wish u have a good day. My name is Lai. Here i got several variables of heavy metals like Zn, Cu, Pb etc. my question is, when i do the correlation test using excel, does it matter the position of each variable? or i can put them randomly and excel will calculate that variables accurately? Thanks 🙂
Lai,
The order of the pairs (or n-tuples) doesn’t matter.
Charles
Hi Charles. Can you give us ideas on how to use our data for our thesis. Thank you very much.
Katherine,
Can you be more specific as to what you need to do with the data?
Charles
Hi Charles can you help me to do my thesis? I don’t know what I will gonna do. Thank you
Katherine,
I happy to answer specific questions.
Charles
Hi Charles, I have a real issue getting my head around stats and as much as I’m trying, I am having some issues handling my data. I have nine sites that I have visited 10 times, taking quadrat samples four times at each site visit and I am trying to find a test to compare my quadrat samples from the site visits to assess how similar or different the sites are from one another in terms of flower coverage. I know the likes of T-testing exists, but I wonder if you could suggest something to allow me to compare all site to each other, at once? Thanks.
H,
The expansion of a t test to multiple sites is ANOVA.
Charles
Dear Charles;
Your thoroughness and timeliness of response is amazing! I have read the comments below but want to be sure I am heading in the right direction. I have a two part question:
1. I have > 10,000 components. When I sell one component I want to know if multiple other component could have also been sold. So for example when a shirt is sold based upon historic sales history there is an 80% chance a tie could have been sold as well and there is a 75% chance a sweater could have been sold. How do I best determine what the likelihood of additional products type could be sold?
2. Is excel the best software to handle this or should I develop the analysis in some other software?
Thank you! Taylor
A slight modification to question 1 above: I’d like to also know if I sold the shirt and the tie together what is the likelihood of selling the sweater (or numerous other products with given combinations). Thanks again!
Taylor,
This might be a simple probability calculation. You might use simulation. It really depends on the details.
Charles
Taylor,
This really depends on the nature of the data that you have. You might be able to get this information from multiple regression.
Charles
Hello Charles;
Thanks for your reply! I would definitely like to avoid simulation if I can as I don’t want to have to learn a given software to conduct the analysis. I will though if you feel that would serve me best.
A bit more detail to provide you with the nature of the data that you mention above:
Think of the components as parts of a car. If I sold someone a spark plug they may have benefited from having spark plug wires, a distributor cap and perhaps a tool to gap the plug and a tool to install the plug. Now they won’t always need the extra components and tools. However, I want to be able to view the sale to a given customer and determine what other parts could have possibly been sold and what is the likelihood of the customer needing the other components.
So Customer A bought spark plugs I’d like to know that there was an 80% of the time that others customers who purchased spark plugs also purchased spark plug wires. 50% of the time distributors were purchased and 45% a gaping tool.
Hopefully this gives you insight into the type of data. If not please let me know what further information you may need.
Again, thank you for your expertise!
Taylor,
In your last comment you said, “So Customer A bought spark plugs I’d like to know that there was an 80% of the time that others customers who purchased spark plugs also purchased spark plug wires. 50% of the time distributors were purchased and 45% a gaping tool.”
This sounds like simply a problem of having the historic data, exactly of the type you described. If so, you simply take the percentages, not complicated statistics are required.
Charles
Thank you Charles
Hi Charles, I want to test a model consisting of four main variables conflict intensity, flaks, escalation and de-escalation. Each of these variable further contains three more variable high-medium and low. Please guide me what statistical test is best in this case. I treat them as dependent variables. I have read some material on it and am suggested to apply the multi-correlation on it. Waiting for your answer. Best
Shabir,
What hypotheses do you want to test?
Charles
9. To understand the work commitment level of employees at KEL
The following factors induces work commitment into me :
Factors
Highly Satisfied
Satisfied
Neutral
Dissatisfied Highly Dissatisfied
a. Working Hours
b. Security Measures
c. Job Security
d. Transportation Facility
e. Leave Policy
f. ESI , EPF Benefits
10. To assess thse motivation level of employees at KEL
The following factors induces motivation into me :
Factors
Highly Satisfied
Satisfied
Neutral
Dissatisfied Highly Dissatisfied
a. Training & Development
b. Social Status
c. Recognition & Reward for performance
d. Monetary Reward
e. Promotion Policy
f. Counseling
11. To assess the job satisfaction level of employees at KEL
The following factors induces job satisfaction factors into me :
Factors
Highly Satisfied
Satisfied
Neutral
Dissatisfied Highly Dissatisfied
a. I consider my job pleasant
b. I feel real enjoyment at my work
c. I am enthusiastic about my work
d. I feel to stay with my organization even if new opportunity is advantageous to me
e. I feel happy to spent rest of my career at this organization
f. I feel part of the family at my organization
12. To assess the Employee – Employer relationship at KEL
The following factors build Employee – Employer relationship :
Factors
Highly Satisfied
Satisfied
Neutral
Dissatisfied Highly Dissatisfied
a. Conflict Resolution
b. Grievance Handling Mechanism
c. Trade Unions Support
d. Healthy Communication
e. Good Leadership
f. Ethical work practices
sir i want to done the mutiple correlation for the above 4 questions according to my projct work.I am liitle wek in maths.can you help me sir
You can create the pairwise correlations using Excel’s CORREL function. You can get all such correlations using Excel’s Correlation data analysis tool.
To get the multiple correlation of any one of the questions against the other 3 questions you can perform a multiple linear regression using Excel’s Regression data analysis tool and use the Multiple R value.
How to perform each of these is described on the Real Statistics website.
Charles
Hi Charles
Please could you assist me. I am required to find correlation between 4 variables: time, temperature, rainfall and stream flow. Please could you advise a formula that I could use to find the correlation between these 4 variables. Thank you
Fatima,
See https://real-statistics.com/multiple-regression/multiple-correlation-advanced/
Charles
Thank you!
hey,
I have data of 600 people out of which only 15 got passed. I want to find the correlation between these two entries. How can I calculate??
You can use the CORREL function to calculate the correlation between two data sets.
Charles
Hi charles, I found your blog is so helpful. thank you very much. I am doing research in computer Science Engineering. I am not good at Math. i need to find out the correlation between the two variables with respect to third variable . For example i have 2 features like GPA, IQ ,SALARY and class labels(PROFESSIONAL, NON PROFESSIONAL). now i want to know the correlation between the GPA and SALARY with respect to Class label.what kind of Formula i should use. what if i refer i can find out my answer? please help me.
Elakkiya,
You can use the MCORREL function as described on the referenced webpage. Alternatively you can perform multiple regression and use the calculated correlation value.
Charles
Thank you very much
Hello Charles,
Basically i am not into math. But I need some help in correlation which I need to use in my Structural engineering research work. Hope you would help me out with this.
I have the data for different states in India, for the construction type of the building i.e., Material of wall and material of roof (Sheet 1). And I have the data for these two tables correlated (Sheet 2). But the problem is I am not able to find the methodology about how the values were executed in sheet 2. I am attaching the excel files link.
https://www.dropbox.com/s/n5wtcq4q83hjq1d/census%20state%20wise.xlsx?dl=0
Thank you in advance.
Ravi,
I was only able to access Sheet 1.
For simple correlations (between two samples), you can use Excel’s CORREL function. For correlations between one variable and multiple variables you can use regression. For more complicated analyses, perhaps Canonical Correlation would be useful.
Charles
Hello Charles, please advise. I am currently trying to run a regression analysis with 5 Independent variables, and one dependent. I am trying to determine if the factors( IV) influence the DV. The regression analysis continues to yield very high P-values and only one significant T-Stat. I believe that for this problem I should be finding the correlation but, I do not know how to find the correlation of data with regard to multiple IV’s. What is the best way to find the correlations and see if the IV’s indeed are influencing the DV? I thank you in advance!
John,
The regression analysis actually includes this result (i.e. the Multiple Correlation value on the report). If only one IV has a significant p-value, then only that variable has a significant influence on predicting the DV.
Charles
hi charles,
can u please help me with this. my thesis is MDCT PREDICTORS OF SURGICAL INTERVENTION IN ADHESIVE SMALL BOWEL OBSTRUCTION. so basically i am trying to predict whether a patient with intestinal obstruction needs surgery or not on the basis of CT scan findings. i have taken 75 retrospective cases and evaluated whether these findings (6) were present or absent in case of intestinal obstr. patient. and then i saw in the medical records, how many of them were operated. so i calculated the senisitivity, specificity, PPV and NPV of each of these findings/variables in predicting surgery in a case of intestinal obstruction. but now i want to apply these findings in 25 prospective cases to see whether or bot my hypothesis is right. please tell me if there is a way to do it and if yes how. thanks.
One potential approach is logistic regression. See the following webpage:
Logistic Regression
Charles
Hi Charles,
I think I’ve made a know in my head. My thesis is on ethical leadership, inclusion and employee voice. Basically, I hypothesis that if employees perceive their leadership to be ethical it will lead to higher perception of inclusion and employee voice. I also want to collect demographics as control variables.
I’m using 3 Likert scale questionnaires (ordinal data), to ask employees about 1. Ethical Leadership 2. Climate of inclusion 3. Employee voice (employees speaking up). On one hand this looks like a correlation, as there’s no cause (independent variable), though on the other hand wouldn’t Ethical leadership be an independent variable? In the sense that I hypothesis it will affect climate of inclusion and employee voice?
Oscar
Oscar,
You can certainly view ethical leadership as an independent variable. Yes, in this case you can test whether more or less “ethical leadership affects [i.e. correlates with] a climate of inclusion and employee voice”. You might use correlation, regression, t tests, ANOVA, etc. to test this.
I don’t know what you mean by “I also want to collect demographics as control variables.” In what sense will these be control variables?
Charles
Hello, there.
I am conducting a mini research project for my degree.
I am researching based on three variables which include depression, neuroticism, and procrastination. I am looking to find a relationship between all three variables. I am not sure of what kind of analyses to use. Could you give me any advice?
Elena,
Which analyses to use depends on a number of factors, including: (1) what sort of data you have, (2) what you mean by “relationship”, (3) what sort of hypotheses you might want to test, etc.
In any case, in these sort of situations, it would be common to use multiple correlation or multiple regression.
Charles
Hi,
I am doing my research on socio-economic determinants of child labor. I am really confused to use which method as i have more than 10 variables like poverty,parental education and unemployement, flaws in education,government ignorance,dowry,early marriages,parental death, migration, shocks. And are these factors effecting child labor if yes than to what extent. kindly guide me to use which method and explain a bit how?
Kiran,
It sounds like you want to figure out which variables to retain when conducting linear regression (this is related to multiple correlation). The variables which have a non-significant regression coefficient are candidates for removal.
In addition, I suggest that you look at the following webpages.
Testing significance of extra variables
Stepwise regression
Shapley-Owen decomposition
Charles
Hi! I am working on my dissertation in which I have to correlate students math test score with different variables like confidence, interest, perseverance etc. I have tried to get help from online tutorials but they are not very helpful. Can you please guide me how to perform correlation with all these around 5 variables. Within one variable I have framed around 5 questions. An immediate reply will be highly appreciated.
Nadra,
You can do this by performing a linear regression and using the R value, which is the correlation.
Charles
Hi I am working on a research project where i have to determine the co relation between Locus of control – Internal and External and stress and anxiety. Here there are two independent variables and two dependent variable. Which method of calculating co relation and which tool will be beneficial for that for a sample of 100.
Anuradha,
What hypothesis (or hypotheses) are you trying to test?
Charles
The hypothesis is that there is relationship between locus of control and stress and anxiety.
Now locus of control is both internal and external which here are independent variables while individually stress and anxiety are dependent variable.
Generally, correlation is defined when there is one dependent variable and one or more independent variables. This is related to linear regression. It is not clear what you mean by correlation when you have two dependent variables and two independent variables.
Charles
hello thanks for this forum..please i really need help here.. i am doing a master 2 research on physical education and sports..and my topic is ” A comparative study of the uchikomi shuttle run test, special judo fitness test and 20m shuttle run test in physical fitness for cameroon judoists”. i have three independent variables and one dependent variables..pls i need to know wch test i can use to analyse my data
Edmond,
You have not provided enough information for me to be able to give an answer. What hypothesis are you trying to test?
Charles