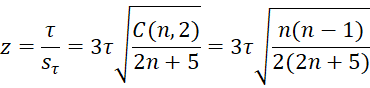
A commonly accepted measure of standard error for Kendall’s tau is

This assumes the null hypothesis that x and y are uncorrelated.
Properties
Property 1: For sufficiently large n (generally n ≥ 10), the following statistic has a standard normal distribution (assuming that x and y are not correlated):
We can use Property 1 to test the null hypothesis that x and y have a (population) correlation coefficient of zero.
Example
Example 1: Repeat Example 1 of Kendall’s Tau Hypothesis Testing using the normal approximation of Property 1.
The analysis is shown in Figure 1.
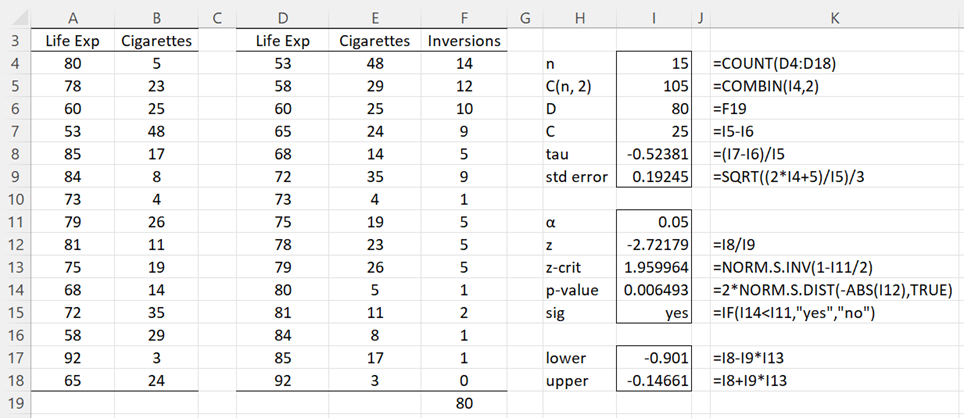
Figure 1 – Hypothesis testing using a normal approximation
Since p-value = .006 < .05 = α (two-tail test), the null hypothesis is rejected, and so we conclude there is a negative correlation between smoking and longevity.
We can also establish a 95% confidence interval for tau as follows:
τ ± zcrit ∙ sτ = -.524 ± (1.96)(.192) = (-.901, -.147)
Worksheet Functions
Real Statistics Function: The Real Statistics Resource Pack provides the following array function.
KCORREL(R1, R2, lab, tails, alpha, ties): returns a 7 × 1 column array containing Kendall’s tau for the samples in R1 and R2, the standard error, z-stat, z-crit, p-value, and lower and upper bound of the 1 – alpha confidence interval if lab = FALSE (default). If lab = TRUE, then the output is a 7 × 2 range which also contains a column of labels. tails = # of tails: 1 or 2 (default). alpha = significance level (default .05). If ties = TRUE (default), then a ties correction is applied.
Referring to the cells in Figure 1, the output from the array worksheet formula =KCORREL(A4:A:18,B4:B18,TRUE,,,FALSE) is displayed on the left side of Figure 2. Similarly, the output from the formula KCORREL(A4:A:18,B4:B18,TRUE,1,,FALSE) is displayed on the right side of the same figure. These are based on tau without a ties correction.
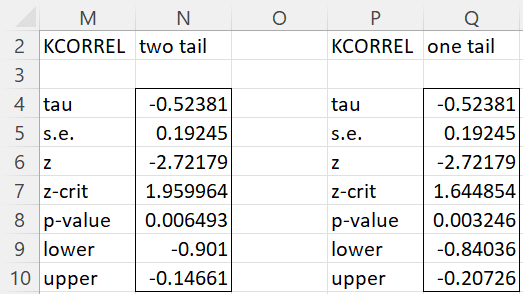
Figure 2 – Output from KCORREL function
Note that the confidence interval for the one-tailed test is either (-∞, -.84036) or (-.20726, ∞), depending on whether your hypothesis uses a left tail or right tail critical value.
Links
Examples Workbook
Click here to download the Excel workbook with the examples described on this webpage.
References
eGyanKosh (2017) Unit 2: other types of correlation
http://egyankosh.ac.in/bitstream/123456789/20956/1/Unit-2.pdf
Wikipedia (2015) Kendall rank correlation coefficient
https://en.wikipedia.org/wiki/Kendall_rank_correlation_coefficient
Hello Charles,
Is it normal to obtain the upper bound confidence interval greater than one (or the lower bound confidence interval lower that -1)?
According to my results for a sample of 12 subjects (Tau=0.7273, C=66):
95% CI=0.7273±1.96×1/3 √((2(12)+5)/66)
95% CI=0.7273±0.4331=0.2942-1.1604
The upper bound doesn’t make sense to me, since tau ranges from -1 to 1. Am I doing something wrong?
Thanks,
Wilson
Hello Wilson,
It is possible that the calculation will produce a value larger than 1 (or smaller than -1). In this case, you should use 1 (or 1).
Charles
Great! Thank you for your quick reply.
Wilson
The lower value of the 95% interval appears to be miscalculated in certain circumstances. Am I understanding these values correctly?
Correlation Coefficients
Pearson -0.039222537
Spearman -0.153554464
Kendall -0.080921444
Kendall’s coefficient (test)
Alpha 0.05
Tails 2
tau -0.080921444
s.e. 0.008061344
z -10.03820701
z-crit 1.959963985
p-value 0
lower 0 Should be -0.09672
upper -0.065121499
Thank you,
Dave
Hello Dave,
Yes, you are correct. The software inadvertently changes any lower bound less than 0 to 0 for KCORREL or SCORREL. I plan to correct this in the next bug-fix release. Thank you very much for catching this error.
Charles
Charles,
Sorry it’s me again – asking too many questions!
With regard to the 95% confidence interval calculated here I am a bit puzzled by it. As I understand it, H0 is tau is 0 (no correlation). Are the upper and lower bounds not the 95%CI for this null hypothesis? In this case lower would be 0-1.96*0.192=-0.377 and upper=+0.377. The tau stat calculated is -0.524 which is indeed outside the 95%CI and is statistically significant which is what you had calculated from the p-values. I notice that in the excel sheet in the long form calculation it is calculated this way and also in the kcorrel function.
If my understanding here isn’t correct what then is the 95%CI calculated here?
The confidence interval is based on the observed value, tau in this case. Thus the interval is tau ± some amount. If 0 is not in this interval then we reject the null hypothesis.
There is a typo in the calculation of the confidence interval shown on the referenced webpage. It should read
τ ± zcrit ∙ se = -.524 ± (1.96)(.192) = (-.901, -.147).
This has now been corrected.
Charles