Basic Concepts
If there are a large number of ties, then the denominator in the definition of Kendall’s tau (see Kendall’s Tau Basic Concepts) should be replaced by
![]()
where nx is the number of pairs with a tie in variable x , and ny is the number of pairs with a tie in variable y. This version of Kendall’s Tau is often called tau-b (instead of the previous version, which is called tau-a).
The calculation of ny is similar to that of D described in Kendall’s Tau Hypothesis Testing, namely for each i, count the number of j > i for which xi = xj. This sum is ny. Calculating nx is similar, although potentially easier since the xi are in ascending order.
Since in general C(m, 2) = 1 + 2 +⋯+ (m–1), it follows that
![]()
Here, ti = the number of elements in the ith group of ties among the x values. uj = the number of elements in the jth group of ties among the y values.
Examples
Example 1: Repeat the analysis for Example 1 of Kendall’s Tau Normal Approximation using Kendall’s tau for the data in range A3:B18 of Figure 1.
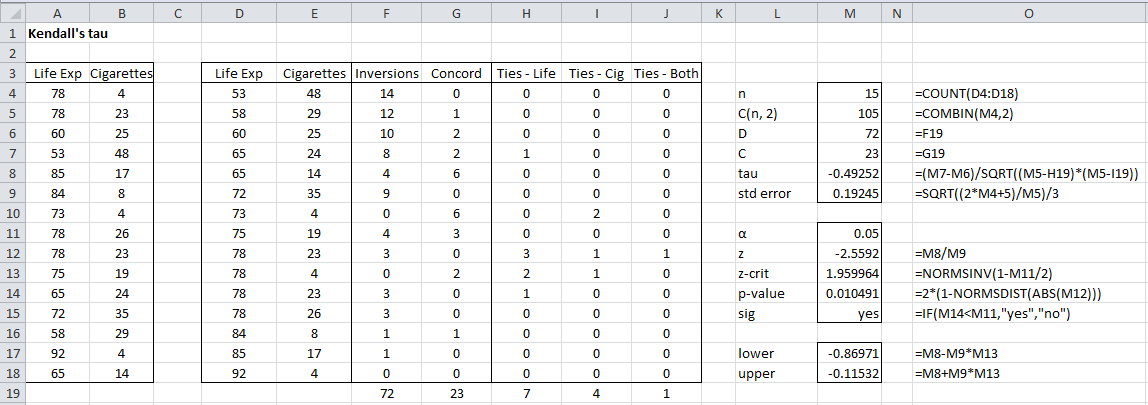
Figure 1 – Hypothesis testing for Kendall’s tau (with ties)
As we did in Example 1 of Kendall’s Tau Hypothesis Testing, we first sort the data, placing the results in range D3:E18. This time we can see that there are ties.
The calculation is similar to that used for Example 1 of Kendall’s Tau Normal Approximation, except that we need to account for the ties. In particular, we need to modify the formula for inversions (D). E.g. cell F4 in Figure 1 contains the formula =COUNTIFS(E5:E$19,”<“&E4, D5:D$19,”>” & D4).
In order to calculate the modified denominator for tau, we need to calculate nx and ny. E.g. the calculation for nx is carried out by putting the formula =COUNTIF(D5:D$19,”=”&D4) in cell H4. We next highlight the range H4:H18 and press Ctrl-D to copy this formula into all the relevant cells in column H. Placing the formula = SUM(H4:H18) in cell H19 yields the value for nx. The value ny (cell I19) can be calculated similarly.
We can calculate the value of C as the sum of the concordance elements in a fashion similar to that used to calculate D.
E.g. cell G4 contains the formula =COUNTIFS(E5:E$19,”>”&E4, D5:D$19,”>” & D4). Alternatively, we note that C = C(n, 2) – D – T. Now C(n, 2) = C(15, 2) = 105 (cell M5), D = 72 (cell F19) and T = nx + ny – nx&y = 7 + 4 – 1 = 10. The number of ties is equal to the number of ties in x plus the number of ties in y minus the number of ties for both x and y, nx&y. We calculate nx&y as the sum of the cells in column J, where, for example, cell J4 contains the formula =COUNTIFS(D5:D$19,”=”&D4,E5:E$19,”=”&E4).
Kendall’s tau (cell M8) is calculated by the formula =(M7-M6)/SQRT((M5-H19)*(M5–I19)).
Modification of the Standard Error
If there are a lot of ties, we also need to modify the calculation of the standard error as follows:
![]()
![]()
![]()
![]()
![]()
![]()
Thus![]()
Example 2: Repeat the analysis for Example 1 using the improved version of the standard error and z described above.
We show the analysis in Figure 2.

Figure 2 – Hypothesis testing for Kendall’s tau: improved version
C and D are calculated as before, but this time we handle the ties using the formulas
![]()
Column H contains a non-zero value only for those values in column D (the x values) which are the first one of a group of ties. This value is one less than the number of ties in that group. Similarly, column I handles the ties from column E (the y values). E.g. the value 78 occurs 4 times in column D. The first of these occurs in cell D12, and so cell H12 contains the value 4 – 1 = 3. This is done using the formula
=IF(COUNTIF(D$3:D11,D12)=0,COUNTIF(D13:D$19,D12),0)
Thus, there are C(4, 2) = 6 pairs with the value 78.
Since for any m, C(m, 2) = m(m–1)/2, we can calculate the number of ties for x, nx = 
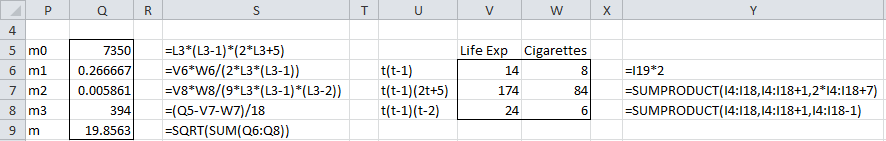
Figure 3 – Calculation of standard error
From m (cell Q9), we calculate the standard error (cell L9) and the z-score (cell L12) as shown in Figure 2.
Worksheet Functions
We can employ the KCORREL function with ties = TRUE (default) to carry out all these calculations automatically (see above). Alternatively, the Kendall’s Tau option of the Correlation data analysis tool can be used to carry out all these calculations (see Correlation Data Analysis Tool).
For example, we can obtain the key results for Example 2 by using the formula =KCORREL(A4:A18,B4:B18,TRUE), as shown in Figure 4.
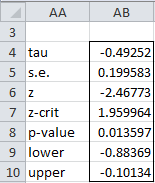
Figure 4 – Output of KCORREL with ties correction
Links
Examples Workbook
Click here to download the Excel workbook with the examples described on this webpage.
Reference
Wikipedia (2014) Kendall rank correlation coefficient
https://en.wikipedia.org/wiki/Kendall_rank_correlation_coefficient
Ignore the above Charles, worked it out.
Hi Charles. Can you explain in more detail the formulas in columns V & W. I’m having trouble getting your numbers, specifically V7, W7 & V8. Many thanks.
Hello Ian,
I have added a link towards the bottom of the webpage where you can download the spreadsheet used to calculate the formulas in the examples on the webpage. I hope this clarifies V7, W7 and V8.
Charles
Cheers Charles, much appreciated.
Dear mr. Zaiontz,
Your calculation for the p-value seems to indeed match the one shown on Wikipedia, and is also used I think in the R function cor.test(ord1, ord2, method=”kendall”).
However, when running the same example in SPSS I got a p-value of 0.002. Quite a difference than the one used here with 0.0135972.
I did some digging, and the formula used by SPSS is from Brown and Benedetti (1977, p. 311). SAS/Stata appears to be using the same as SPSS. This alternative divides Tau-b by a standard error. The formula can be found in this document on page 1739 (http://support.sas.com/documentation/cdl/en/statugfreq/63124/PDF/default/statugfreq.pdf). The calculation they use will result in the same result (p-value) for Tau-b, Tau-c and Gamma.
Would you perhaps know what makes these formula’s different? Are they testing the same thing and is one just an approximation of the other, or is there some fundamental different interpretation?
Reference:
Brown, M. B., & Benedetti, J. K. (1977). Sampling behavior of test for correlation in two-way contingency tables. Journal of the American Statistical Association, 72(358), 309–315. https://doi.org/10.2307/2286793
Dear Peter,
Thanks for pointing me in this direction.
I will look into it and get back to you.
Charles
I found mistake in Figure 1. Сell F7 should contain 9 insteed 8!
Sory. my bad.
Thank you for this site and for your very helpful examples in this page. I notice there are variations of formulae for the tau-b.
Example 1: https://en.wikipedia.org/wiki/Kendall_rank_correlation_coefficient#Tau-b
Example 2: https://online.stat.psu.edu/stat509/node/158/
By my calculations, they appear to give 2 different taus (three differences with yours). I was wondering what the reason is behind using ‘your’ formula. Is there any sigificance behind the differences in the formulae?
Hello Francis,
I don’t know why there are so many different ways to calculate tau-b. Real Statistics actually shows two different ways to calculate tau-b, one is supposed to be more accurate if there are a lot of ties. You could try to compare the different approaches to see whether there is much of a difference between the results.
Charles
Greetings Charles.
Since my dataset has (plenty of) ties I am using Tau-b, but I noticed that sometimes p-value be less than 0.05 and Tau-b be greater than TauCRIT. Would it be correct to say that this technique (Tau-b checking that p-value be less than 0.05) and Kendall’s Tau Hypothesis Testing (checking that Tau-a be greater than TauCRIT) are mutually exclusive? And for that matter, if I know that in my dataset there are ties should I ignore the value of TauCRIT and pay attention only to p-value be less than 0.05?
Thanks,
Andrés
Andrés,
The result should be the same whether you use the p-value or critical value whether there are ties or not. Of course, you won’t necessarily be able to use the table of critical values since this assumes no ties. Can you give me an example where you get the opposite result using the p-value vs. the critical value?
Charles
Hi,
for some reason my Excel spreadsheet gives normal CORREL and SCORREL results but any form of KCORREL just gives the #VALUE! error symbol (even if I do it with the control-M method). Do you have any idea why this might be the case? My data is a set of 400 participants with knowledge levels 0, 1 or 2 and likert scale survey responses 1 to 5.
Thanks!
Derek,
If you send me an Excel file with your data and results, I will try to figure out what has gone wrong. You can find my email address at
Contact Us
Charles
Thanks Charles! I will send you the sheet now.
Actually, I think I may have figured it out… I had the knowledge level column sorted so that all the 0s were followed by all the 1s etc. When I resort by respondent ID number (so the 0s and 1s and 2s are in random order) all three CORRELs seem to work.
Derek,
Good to hear this.
Charles
It seems to me that in Figure 2, H19 should = 4 and I19 should = 3 because the formulae for calculating ties were changed to
=IF(COUNTIF(D$3:D11,D12)=0,COUNTIF(D13:D$19,D12),0) etc. and
=IF(COUNTIF(E$3:E11,E12)=0,COUNTIF(E13:E$19,E12),0) etc.
Indeed, if you simply sum the numbers in cols H and I in figure two, the values don’t match the values of H19 and I19.
This is in turn should have resulted in changes to the value of tau in Figure 2 but it still has the same value as in figure 1. Also, d seems to be calculated using the incorrect (?) values of H19 and I19. I think the value of d should be 101.5.
Norm,
I am sorry, but I don’t understand your comment. The key to the calculation is that the values in cells H19 and I19 need to be the sum of the C(t_i,2) and C(u_i,2) values respectively, and not simply the sums of the t_i and u_i values.
Charles
In figure 1, your formulas calculating ties-life and ties-cig also count ties-both. In other words you are double-counting ties-both. You can see this because if you add the total Concordances + discordances + ties-life + ties-cig + ties-both you get 107. Cell M5 says you should only have 105 pairs. The 2 extra pairs are the single pair in ties-both being counted twice.
Grant,
I believe that I am using Concordances + discordances + ties-life + ties-cig – ties-both, with the last term subtracted, not added.
Charles
This me again,
The results are correct. I was little confused.
But in Figure 2, the column J is not used. Why we compute Both tied?
Thanks,
Abdelkader,
Column J is used to compute cell L7.
Charles
Hi Dr,
Many thanks for your time.
Cell L7 doen’t has any formula. May be you mean M7, but the formula is “=G19”. Not “J”. No cell is linked to “J”. Pls check & confirm.
Thanks
Are you referring to Figure 1 or Figure 2?
Charles
Figure 1.
Yes, you are correct that column J is never used.
Charles
Hi Dr,
Using Formula as Figure 2 gives different results than your macros in RealStats.xlam. May i download a new one?
Thanks
Hello Dr.,
many thanks for your quick replies.
I used formulas as you indicates.
In H4 the formula is =COUNTIF(D5:D$19,”<=“&D4) . Note "<=" instead of "<". the result is correct. Is it correct??
In I4 i used the formula: =COUNTIF(E5:E$19,”<=“&E4) . I get 14, while you get 0.
Where is the problem?
Thanks
Abdelkader,
The formula in cell H4 is =COUNTIF(D5:D$19,”=“&D4) with an “=” and not “<". I have now corrected this on the referenced webpage. Similarly the formula in cell I4 is =COUNTIF(E5:E$19,”=“&E4). Thanks for identifying this problem. Charles
When I artificially increase the number of ties in my Y variable so that they make up more than %75 of my data it causes an error because the equation for “m” (cell S9) ends up taking the squareroot of a negative number.
Does the calculation not work on data with too many ties, or does the formula need to be changed so that you take the square root of the absolute value instead?
Dugan,
I am not aware of this problem or how to solve it. Can you send me an Excel file with the data you used to create the problem so that i can take a look at it? Please send it to the email address found on Contact Us.
Charles
One thing I’m missing in your pages discussing of Kendall’s tau is how to interpret the importance of the effects. Statistical significance is one thing (i.e. p values), but how high a value of tau would represent substantive, practically significant correspondence?
Specifically, here’s my application: I have two lists of measures taken at different times (around five years apart) for around 20 countries or so. My hypothesis is that the countries have not changed substantively in this five-year period. The exact values of the measures is meaningless in my context (so, differences in means via a t-test is inappropriate); all that matters is that the ordering (ranking) of each country relative to each other has not changed. So I am hypothesizing that the two lists have a Kendall’s tau that is substantively close to +1.0.
I know that this is a case of hypothesis noninferiority/equivalence testing (not standard hypothesis testing), but my question is, what minimal value of tau (e.g. +0.9) would be considered so high that the differences between the two lists would be considered substantively negligeable? How would I even go about finding such a number?
I would appreciate any help or pointers you might give me in answering this question.
This is a subjective judgement. I would say that a correlation coefficient of +.7 or higher would commonly be viewed as high.
When the correlation coefficient r is used as an effect size, a rough estimate of effect size is that r=.5 represents a large effect (explains 25% of the variance), r=.3 represents a medium effect (explains 9% of the variance), and r=.1 represents a small effect (explains 1% of the variance).
Charles
Thanks for your very useful resources. This is just what I was looking for. So, my understanding is that using the adjusted formula will always give the most accurate results, no matter how many ties there are. If there are no ties, then the results are identical to the regular formula. However, if there are ties, then the adjusted formula is more accurate. If there are only a few ties (how few is “few”?), then the differences are negligeable. If there are a large number of ties (how large is “large”?), then the results of the regular formula are unreliable.
So, my question is: what is “a large number of ties”? That is, how large is “large”? 10% (e.g. out of 20 items, 2 are ties)? 5%? In other words, when would you decide you have enough ties to justify using this adjusted formula?
And a related question (which would render the prior question moot): Is there any harm in always using this adjusted formula that accounts for ties instead of the simpler one? If this adjusted formula is always more accurate, then I wouldn’t even bother ever using the simpler one (since Excel is doing the hard work for me).
Yes, I would always use the formula with the ties adjustment.
Charles
Thank you for your help. I think you have provided a very useful resource here
In Figure 2 how are the SUM values in columns H and I, 7 and 4?
Peter,
The “sums” are not simple totals. They are the sums of form f(f+1)/2. In column H the non-zero entries are 1 and 3. The ties contribution is therefore (1*2)/2 + (3*4)/2 = 1 + 6 = 7. This is calculated via the formula =SUMPRODUCT(H4:H18,H4:H18+1)/2.
Charles
Please ignore my previous question I have found my error!
I’m trying to use the formula for calculating Kendall’s tau with ties, but when I enter the modified formula for D in Excel 2011 for Mac I am told there are too many arguments. Do you have a procedure which can be used with this version of Excel? Many thanks.