Basic Concepts
In paired sample hypothesis testing, a sample from the population is chosen and two measurements for each element in the sample are taken. Each set of measurements is considered a sample. Unlike in two-sample hypothesis testing (see Two-sample t-Test), the two samples are not independent of one another. Paired samples are also called matched samples or repeated measures.
For example, if you want to determine whether drinking a glass of wine or drinking a glass of beer has the same or different impact on memory, one approach is to take a sample of say 40 people, and have half of them drink a glass of wine and the other half drink a glass of beer, and then give each of the 40 people a memory test and compare the results. This is the approach with independent samples.
Another approach is to take a sample of 20 people and have each person drink a glass of wine and take a memory test, and then have the same people drink a glass of beer and again take a memory test, after which we compare the results of the two tests. This is the approach used with paired samples.
Advantages
The advantage of this second approach is the sample can be smaller. Also since the sampled subjects are the same for beer and wine there is less chance that some external factor (confounding variable) will influence the result. The problem with this approach is that it is possible that the results of the second memory test will be lower simply because the person has imbibed more alcohol. This can be corrected by separating the tests in time, e.g. by conducting the test with beer a day after the test with wine.
It is also possible that the order in which people take the tests influences the result (e.g. the subjects learn something on the first test that helps them on the second test, or perhaps taking the test the second time introduces a degree of boredom that lowers the score). One way to address these order effects is to have half the people drink wine on day 1 and beer on day 2, while for the other half the order is reversed (called counterbalancing).
The following table summarizes the advantages of testing with paired samples versus testing with independent samples:
| Paired Samples | Independent Samples |
| Need fewer participants | Fewer problems with fatigue or practice effects |
| Greater control over confounding variables | Participants are less likely to figure out the purpose of the study |
Figure 1 – Comparison of independent and paired samples
Obviously, not all experiments can use the paired sample design. E.g. if you are testing differences between men and women, then independent samples will be necessary.
As you will see from the next example, the analysis of paired samples is done by looking at the difference between the two measurements. As a result, this case uses the same techniques as for the one-sample case, although usually, it is easier to use either the paired t-test data analysis tool or the T.TEST worksheet function with type = 1.
Hypothesis Testing
Example 1: A clinic provides a program to help their clients lose weight and asks a consumer agency to investigate the effectiveness of the program. The agency takes a sample of 15 people, weighing each person in the sample before the program begins and 3 months later to produce the table in Figure 2. Determine whether the program is effective.
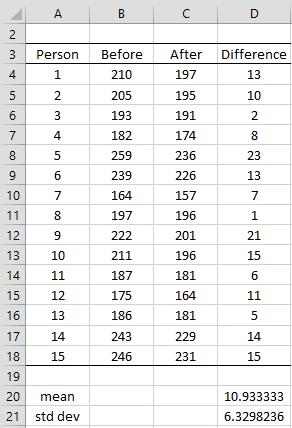
Figure 2 – Data for paired sample example
Let x = the reduction in weight 3 months after the program starts. The null hypothesis is:
H0: μ = 0; i.e. any differences in weight is due to chance (two-tailed test)
We can make the following calculations using the difference column D:
s.e. = std dev /

tobs = (x̄ – μ) /s.e. = (10.93 – 0) /1.63 = 6.6896995
tcrit = T.INV.2T(α, df) = T.INV.2T(.05, 14) = 2.1447867
Since tobs > tcrit we reject the null hypothesis and conclude with 95% confidence that the difference in weight before and after the program is not due solely to chance.
Alternatively, we can use a type 1 T.TEST to perform the analysis as follows:
p-value = T.TEST(B4:B18, C4:C18, 2, 1) = 1.028E-05 < .05 = α
and so once again we reject the null hypothesis.
As usual, for the results to be valid, we need to make sure that the assumptions for the t-test hold, namely that the difference measures are normally distributed or at least reasonably symmetric. From Figure 3 we see that this is the case:
")
Figure 3 – Box Plot for difference measures (column D of Figure 2)
Data Analysis Tools
Excel Data Analysis Tool: We can use Excel’s t-Test: Paired Two Sample for Means data analysis tool. The output from this data analysis tool is shown in Figure 4.

Figure 4 – Excel data analysis for paired samples
The Pearson Correlation entry in Figure 4 is explained in Correlation.
Real Statistics Data Analysis Tool: We can also use the T Test and Non-parametric Equivalents data analysis tool in the Real Statistics Resource Pack to get the same result.
To use this tool press Ctrl-m and select T Tests and Non-parametric Equivalents from the menu (or from the Misc tab if using the Multipage interface). A dialog box will appear (as in Figure 1 of t Test Analysis Tool). Enter B3:C18 in the Input Range 1 field (or B3:B18 in Input Range 1 and C3:C18 in Input Range 2) and choose the Column headings included with the data, Paired Samples, and T Test options. When you press the OK button, the output shown in Figure 5 is displayed.
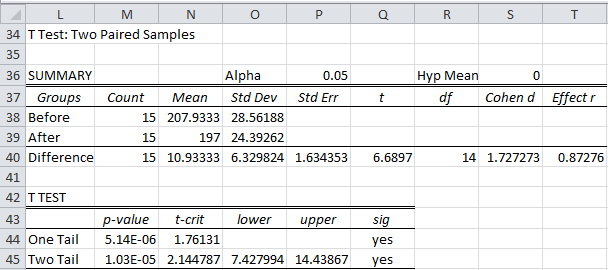
Figure 5 – Real Statistics data analysis for paired samples
Missing Data
The input data for the paired-sample t-test can have missing data, indicated by empty cells or cells with non-numeric data. Such cells will be ignored in the analysis.
Example 2: Repeat Example 1 using the data in range B24:C39 of Figure 6.
In this example, there is missing data for subjects 5, 7, and 10. The analysis is rerun with the data for these people removed. Note that some of the formulas have been changed to account for the missing data. E.g. when there is no missing data, cell H27 can contain the simple formula =AVERAGE(B25:B39), but since there is missing data the following formula is used instead:
=SUMPRODUCT(ISNUMBER(B25:B39)*ISNUMBER(C25:C39),B25:B39)/G27
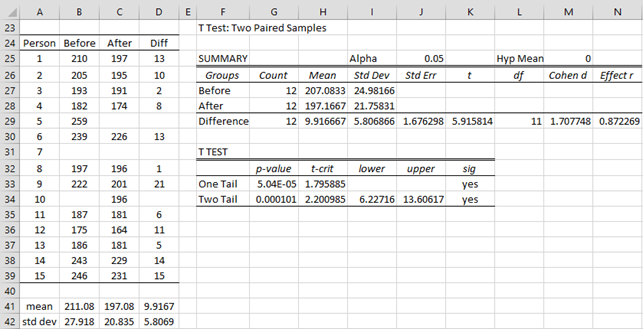
Figure 6 – Paired t test with missing data
Caution: If you have missing data you can change the data values and even fill in the missing data with numeric values and the resulting analysis will be correct. If, however, the input does not contain any missing data, you can change any of the data values and still get a valid analysis but if you change a numeric value to a non-numeric value then the analysis will not be correct and you will need to rerun the data analysis tool to get the correct results.
Comparing paired samples with independent samples tests
Suppose we run the same analysis for the data in Example 1 from Two Sample t Test with Equal Variances using the t-test with independent samples and compare the results with those we obtained for paired samples:

Figure 6 – Excel data analysis for independent samples
We summarize the results from the two analyses as shown in Figure 7.

Figure 7 – Comparison of paired and independent sample t-tests
Note that the mean differences are the same, but the standard deviation for the paired sample case is lower, which results in a higher t-stat and a lower p-value. This is generally true.
One-sample test
Although Real Statistics provides a data analysis tool for one-sample tests, Excel doesn’t provide a standard data analysis tool for this case. The T.TEST function with type = 1 and the paired samples data analysis tool can, however, be used for the one-sample case by simply creating a null paired sample with all zero data.
Example 3: Repeat Example 1 of One Sample t-Test using the above observation.
Figure 8 shows how to do this using Excel’s paired t-test data analysis tool.

Figure 8 – Use of paired sample data analysis for one sample test
Effect size
Since the two-sample paired data case is equivalent to the one-sample case, we can use the same approaches for calculating effect size and power as we used in One Sample t Test. In particular, Cohen’s effect size is
![]()
where z = x1 – x2. There are other versions of Cohen’s effect size, including drm and dav. These are described at Cohen’s d for Paired Samples.
Examples Workbook
Click here to download the Excel workbook with the examples described on this webpage.
References
Howell, D. C. (2010) Statistical methods for psychology (7th ed.). Wadsworth, Cengage Learning.
https://labs.la.utexas.edu/gilden/files/2016/05/Statistics-Text.pdf
Nelson, S. L. and Nelson, E. C. (2016) How to use the t-test data analysis tool in Excel
https://www.dummies.com/article/technology/software/microsoft-products/excel/how-to-use-the-t-test-data-analysis-tool-in-excel-152093/
Zar. J. H. (2010) Biostatistical analysis 5th Ed. Pearson
Hello Charles,
I am to run a T-test on two surveys (Pretest & Post test). Each individual has a score from 0-100. With just two variables (survey 1 and survey 2) and only a sample size of 6, would a T-Test be acceptable? And would it be paired or independent, and one tailed or two tailed?
Hello Gus,
1. With 6 subjects measured pretest and post-test, you would use a paired t test.
2. The t test is appropriate provided the differences between the pre- and post-test values are normally distributed or at least reasonably symmetric.
3. With only 6 subjects the statistical power of the test won’t be very high
4. Whether to use a one-tailed test or a two-tailed test depends on the hypothesis that you are testing. Generally, you will use a two-tailed test. When you are pretty sure (prior to collecting data) that one of the tails is very unlikely, then you can use a one-tailed test.
Charles
Hi Charles,
In the paired t-test, are the differences absolute (direction ignored) or relative (using a timepoint reference)?
Best,
Andrew
Hello Andrew,
Neither. If one set is x1,x2,…,x9 and the other is y1,y2,…,y9, then the difference are z1,z2,…,z9 where zi = xi-yi.
Charles
Can you say more about sample size for a paired t-test? I can’t find a definitive answer. I’ve seen people say at least 30. But some of your examples have 12 and 20. Does it matter, as long as it’s the same sample tested at two different times?
Hello Mary Beth,
You can perform the paired t test even with small samples, but whether you get useful results may depend on the sample size and there is no one simple answer. The two main issues are (1) normality and (2) statistical power.
(1) The values of 12, 20, 30, etc. are probably related to normality. To use the paired t test, the differences between the pairs must be normally distributed. You can test for normality in many ways, as described on the Real Statistics website (Shapiro-Wilk test, QQ plots, etc.). If the sample is sufficiently large, then you can often count on the Central Limit Theorem to meet the normality requirement. This is where the various values 12, 20, 30, etc. come in. I suggest that you simply test for normality and not worry about the sample size. Fortunately, the paired t test is pretty robust to violations of normality, and so even if the differences between the pairs is not too far off from normality, you should be fine. Generally if the data is reasonably symmetric (i.e. not too skewed), you are ok.
(2) You should make sure that your sample is sufficiently large so that you can detect the size of the effect that you believe will result from the experiment. There is no magic number such as 12 or 20 for this. It depends on the expected effect size, the significance level (alpha) and power goal. This is explained at https://real-statistics.com/hypothesis-testing/statistical-power/
Charles
Dear Sir Charles,
My name is Igor, and I really like your articles because they are very didactic!
Do you know of any paired t test (before / after), applied for the case of different variances?
A hug, Igor.
Hello Igor,
The paired t test works even when the variances are different. This is because this test is essentially a one sample test on the differences between the pairs.
Charles
Hi I am struggling to decide whether this is a paired t-test or independent t test. “population mean time spent on outdoor physical activities differs between boys and girls who live in the low polluted area” I think it is independent population t test – but I don’t know how to run the test to only grab the boys and girls from the low polluted area (not high pollution and no pollution) – any advice would be great. Many thanks.
Since the subjects are different (boys vs girls) you need the independent population t test.
How to get the samples from only the low pollution areas is a practical problem that I am not able to address. You probably need to get public information about the pollution levels is different areas under study.
Charles
Hi. If I were to test “Does an NBA team that average more points commit more turnovers?” or to be more specific “”Do teams that score more than 111.2 points a game commit more turnovers than the league average of 14.1?”, is the paired t-test the best way to go? Furthermore, will I used the paired t-test on the ave. of points or ave. of turnovers? Thank you
Hello Rafa,
This looks more like a one sample t test. You look at only the teams that score more than 111.2 points per game and test whether the average number of turnovers is more than 14.1. I am assuming that the sample is not equal to the entire population; otherwise you don’t need to use statistics.
Charles
Hi,
I have a set of questionnaire data with yes/no answers, for a two different teaching methods. I want to compare the students concepts of the outcome of the two teaching methods. So do they prefer method A or B. It has been suggested to me to carry out a paired t-test but I can’t see how this would work as my data is nominal so not normally distributed (I think?). What test would you recommend? I have carried out a Fishers exact test, as I have small numbers, do you think this is the best option? thanks
Hi Claire,
This depends on the questionnaire. If e.g. the questionnaire has say 10 questions and so for each student the total score is between 0 and 10 (where 1 codes a response that is positive to that teaching method 1 and -1 codes for a response that is positive for teaching method 2), then you could use a one sample t test (essentially equivalent to the two paired sample test) against the hypothetical mean of zero (i.e. no difference between the teaching methods. In this case, even though each answer is nominal, the sum of the answers is not nominal. Note that if normality is violated, you could use signed ranks test or some other nonparametric test.
If your questionnaire is not as described above, e.g. it contains only one question, then the Fisher exact test may be the correct approach (depending on the details).
Charles
Good day everyone
We conducted a survey regarding in-store promotions.
I have a question with regard to testing hypotheses. We conducted a survey of 1029 respondents. Both male and females responded. To be exact, 458 males and 571 females responded. I have to determine whether males and females have the same response to the question “do you try products during in-store promotions” a portion (say 500) disagreed and the rest strongly disagreed. How do i go about doing this question please?
Hi Charles,
If I want to check whether method A or method B is the best to represent the population, can I use paired sample t-test to do it?
Thank you.
Jessica
Jessica,
If all the subjects in the sample use both method A and method B, then the paired t test is appropriate. It will determine whether the means for methods A and B in the population are equal or significantly different.
Charles
Hi Charles,
Thank you for your explanation.
But what if my difference is not normally distributed or symmetric, can I still use paired t-test?
Also, I have sent you my Excel file to your email for your reference.
Thank you for your help.
Jessica
Jessica,
It really depends on how non-symmetric the data is. If this assumption is not met, often you can use a nonparametric test such as Wilcoxon’s Signed Ranks Test. If the assumptions for this test are not met then you can use the Signed Test or Bootstrapping.
Charles
Hi Charles!
I have a pre and post education survey (15 questions on a 1-4 scale) that I would like to compare; however, some of the participants dropped prior to the post survey so I have a different number of responses in each set. Also, the surveys were not tracked by the respondent, so I can’t compare person to person or totally drop out the surveys of folks who dropped out. What is the best analysis to use?
Here is my summary data table. 🙂 I’m pretty out of practice with stats, so I know this is probably the most basic question, but I want to ensure I’m doing it correctly. All I have is basic excel as far as tools.
Question Average Score PRE Number of Responses PRE
1 3.00 167
2 2.40 165
3 2.40 166
4 2.91 164
5 2.29 167
6 2.57 162
7 2.96 167
8 2.31 167
9 2.90 165
10 2.76 163
11 2.71 163
12 3.22 166
13 2.74 166
14 3.45 166
15 3.52 167
Question Average Score POST Number of Responses POST
1 3.21 145
2 2.57 145
3 2.55 140
4 2.99 143
5 2.17 145
6 2.75 144
7 2.96 144
8 2.33 146
9 2.90 145
10 2.70 144
11 2.87 146
12 3.28 144
13 2.83 146
14 3.51 145
15 3.58 146
Hello Laura,
Since the same people are in the sample pre and post you don’t have independent samples. You can’t match up the subjects pre and post. Furthermore you don’t have the actual data, only the averages. As a result, I don’t know what statistical test you could use.
In any case, what hypothesis are you trying to test?
Charles
I want to compare indian imants with abroad implants. What statistical testing need to carry out.
hello Meena,
What hypothesis do you want to test and what sort of data do you have?
Charles
Hi Charles,
I am doing a paired T-test to see whether my doctor of nursing practice project at the hospital has made an impact on the workers. I implemented a 4 week stretching program there and after the program was done, the workers filled out a post-survey which includes baseline and post-survey questions as well.
So question 3 asks before the stretching program, how likely were you to stretch at home? and question 4 follows, “after the stretching program, how likely are you to continue doing the program at home?”. So I am hoping to see an increase. I do paired T-test but not sure if my p-value is correct. Numbers all look like this- 1.37901E-26 . It just doesn’t seem right. Will you be able to take a look at my excel sheet if I am able to send the file? Thank you
Jeanie
Hi Jeanie,
1.37901E-26 is a number very close to zero. Feel free to send me an email with an Excel file.
Charles
Hi Charles,
I just performed a paired t test for two treatment groups. However I am unable to ascertain the effect of each treatment group on my before and after results.
Ked,
You can run two separate paired t tests, one for each treatment group. If you also want to compare the results of the treatment groups, you could run a repeated measures ANOVA or ANCOVA.
Charles
Hi Charles,
Im doing a research to see if the price of ETF gold differs from the price of physical gold. can i say that they are paired samples?
Hi Dason,
No, these are probably not paired samples.
Charles
Hi Charles,
I am conducting an experiment on the percentage of oil extracted from two different subsample weight (5kg & 3kg) of a oil palm bunch. Total sample is 20, and I used paired t-test.The result:
t Stat -3.574408382
P(T<=t) one-tail 0.001011416
t Critical one-tail 1.729132792
P(T<=t) two-tail 0.002022832
t Critical two-tail 2.09302405
Do I fully reject the null hypothesis based on p-value<0.05? But the t-value<2.09.
or how to use both value in order to reject/not to reject the null hypothesis?
Many thanks!
Hi Hafizah,
p < alpha is equivalent to absolute value of t-crit < t-value. In either case you would reject the null hypothesis. Thus for the two-tailed test, you reject the null hypothesis since .002022 < .05. But since 2.093 < 3.574 you wouldn't reject the null hypothesis. Something seems incorrect here. If you send me an Excel file with your data, I will try to figure out what is happening. Also why are you performing a paired t test instead of two independent sample t test? Charles
Hi, I think your site might be having browser compatibility issues.
When I look at your blog site in Firefox, it looks
fine but when opening in Internet Explorer, it has some overlapping.
I just wanted to give you a quick heads up! Other then that, very good blog!
Glad you like the blog and thanks for the heads up. I just tested Real Statistics on Microsoft Edge (the replacement for Internet Explorer) and it looks fine.
Charles
Dear Charles,
I would use concentration of metals in enamel and dentin as a mean of measurement, and compare content of metals in dentin vs metal in enamel.
As for life habits, I would use general approach (mean values of metal in enamel vs mean of metal in dentine). Life habits I am studying are smoking, place of living, age and sex. For all of them I would use the same approach, ie. metals in enamel vs metals in dentine.
I hope these information are useful.
Best,
Hans
Dear Charles,
I find your tutorials and explanations really helpful. However, I have some issues choosing an appropriate statistical test for my work. I hope you can help me. I have teeth samples that I have separated on dentine and enamel, from two different geographic places and I have some life habits information from patients. Basically, I want to compare results between dentine and enamel (in general) and then based on the origin and life habits. Which test should I used? Since I have less then 30 samples, I thought that t-test wouldbe appropriate. My null hypothesis would be that there is difference between tooth components in general; difference in toothe components based on origin; based on life habits. Is this a right approach?
Many thanks for advices and help for solution of my issue.
Best regards,
Hans
As a project for class, I am conducting a t-test on data retrieved from a survey. My hypothesis is ” Does all of the information and support latent with E-commerce outweigh the ability to tangibly sense the product you are buying in terms of customer satisfaction”. I used a t-test assuming equal variances in excel with a hypothesized mean difference of 0. The test itself was easy to administer, deciphering the output is another story. Namely the following:
df 14
t Stat 1.534834562
P(T<=t) one-tail 0.073555106
t Critical one-tail 1.761310136
P(T<=t) two-tail 0.147110212
t Critical two-tail 2.144786688
It seems to me that my educated guess was proven- that E-commerce is superior.
My question is does the data prove that?
Michael,
For the two-tailed test, the results show a p-value = 0.147110212. Since this value is larger than alpha = .05 (the value generally employed), this result supports the null hypothesis, and so there isn’t a significant difference between the two populations. This is different from what your intuition is suggesting.
I see that you have conducted a two sample t test, although you are referencing a paired t test. It is important to choose the correct test.
Charles
I believe I understand, I referenced this test:
t-Test: Paired Two Sample for Means
E-comm Physical
Mean 7.961904762 5.321428571
Variance 13.20571429 15.38988095
Observations 7 7
Pearson Correlation -0.522168373
Hypothesized Mean Difference 2
df 6
t Stat 0.256973779
P(T<=t) one-tail 0.402892083
t Critical one-tail 1.943180281
P(T<=t) two-tail 0.805784166
t Critical two-tail 2.446911851
This is quite a bit different from the one I posted, I'm glad you caught that. This is the first one I used, the one approved was a paired sample. I was under the impression that because my hypothesis did not assume that E-commerce was greater or less than that it would be a one-tailed test (as I was only testing one direction- only greater). Am I wrong on this?
This is the test I am to use in my paper, "paired sample" was approved and the three available under data analysis in excel threw me a curve.
Michael,
I don’t know what you mean by “my hypothesis did not assume that E-commerce was greater or less than that”
Regarding when to use a one-tailed test, see the following webpage:
https://real-statistics.com/hypothesis-testing/null-hypothesis/
You can use a one-tailed test, when you very confident that one side of the test will never happen.
Charles
Hello!
I am working on my Master Thesis and I have a question about this test if you can help me. With the example that you use on this article let’s say that I have a group of 20 people and have them try 3 different drinks (Beer, Wine, Wiskey). I used Bonferroni Post Hoc test to find if the differences between the 3 values are significant. I could do the same and compare every value with each other with Paired T Test. This test gives me much different p values than bonferroni. Paired T-test in this case whould be valid?
Stavros,
When you say that you performed a Bonferroni post-hoc test, did you use the post hoc test for ANOVA with repeated measures? The Bonferroni test after ordinary one-way ANOVA will give a different result, and this result is not correct. The default alpha value for a Bonferroni post-hoc test with three variables is alpha/2. If you perform 3 tests then you need to change this to alpha/3; if you only perform 1 test, then you can use alpha.
Charles
Dear Sir,
I use TOPSIS method for ranking a set of patients, but I got two different ranking one form internal and theother from external aggregation.
How to use T test in this case? and what is the suitable formula in Excel?
Regards
Naser,
Sorry, but I am not familiar with the TOPSIS method, except for what I just read on Wikipedia, and so I can’t comment on why you got two different rankings.
Regarding the t test, what hypothesis are trying to test? Excel provides the T.TEST (or TTEST) formula which might be useful. This is described on the Real Statistics website.
Charles
Hello Charles;
Thank you for making stats more understandable
I have a need to check the following:
Our engineering team desinged a new test stand for a specific test we have (leak test) which suppose to be better. They have asked us (Quality) to run the test for each tested unit in both tests and record data
we have collected 230 units data and now they asked us to tell if we think the new test is better
Any suggestions on how to approach?
Haim,
Some potential approaches are:
Paired T Test – referenced webpage
Paired Signed Ranks Test
Bland-Altman
Charles
Hello,
I have a question about the use of the paired t-test.
I’m conducting a research about the efforts for sustainability a certain company.
I used a survey with 80 respondents (employees of that company).
I used a scale from 1 (not important) to 5 (very important).
I want to see if there’s a difference between the perceived importance and the desired importance.
Perceived importance: which level of importance does the company currently award to each item.
Desired importance: which level of importance do YOU wish the company would award to each item.
Examples of items:
– Natural sources protection
– Investment into environmental technologies
– ….
(there are 21 items).
I would like to see if there is a ‘gap’ between the perceived and the desired importance. Can I use the paired t-test to see if there’s a significant difference?
Thank you for your article
Annelien
Annelien,
If each respondent gives one rating for all 21 items (together), then the paired t test seems appropriate (provided the assumptions for the test are met). If each of the 21 items is rated separately, then the multivariate version of the paired t test is used, namely the paired Hotelling’s T-square test, is used. See the following webpage
Paired Hotelling’s T-square Test
Charles
Hi, I was wondering how you would do a power calculation on an unpaired t-test assuming unequal variances?
Momo,
This is covered on the following webpage:
https://real-statistics.com/students-t-distribution/statistical-power-of-the-t-tests/
Charles
Thanks Charles for the article!
I want to check if the amount of fluid a person needs predicted by a formula and the amount a person has actually had are similar. What test should I use to see if the formula works?
I am not able to give a definitive answer without more information. Possible approaches are the paired t test, Wilocoxon signed ranks test or even goodness of fit approaches (Anderson-Darling test).
Charles
Hello Charles,
Firstly thank you for the wonderful article. I have a small doubt for you. I’m conducting a study where I’m comparing percentage change of a variable between the same group after an intervention.I have percentage A (P1) prior to the intervention and P2 after the intervention. I can calculate percentage change but How do i know if the percentage change calculated is significant or not?
Please do let me know at the earliest.
You can use the paired t test for this sort of situation (provided the assumptions are satisfied). See referenced webpage for more details.
Charles
My congratulations for your website and your professionality.
I have one question for you: I’d like to test if a change of exposure of a product (say, an innovative shelf) over a test sample of stores Vs. a matched control sample will be significative. By “matched” I mean that each store in the test sample has a “twin” store in the control sample, according to a set of measures (e.g. volume sales of the product and their change over time). I’d need to estimate the size of the matched samples (equal sizes). I’ve available historical data for all the stores of a given chain, hence I can compute mean and standard deviation of product sales and also of their trend (i.e. percentage change between last year and previous year). So…is this a paired t-test and if yes should I somehow factor in the sample size estimation the correlation between the two matched samples?
Many, many thank for your help!!!
Bruno
Bruno,
Provided you have accounted for all the relevant variability factors in selecting your matched pairs, you should be able to use a paired t test.
The sample size will be based on the differences in whatever you are measuring (presumably product sales) and so you don’t need to look at the correlation between the matched samples.
Great! Thanks! Grazie mille!
Thank you very much for the information. if you don’t mind, I have a question. I am using an inter-rater method to check the reliability (the data of one participant of my sample was analyzed by me, then, the same one was analyzed by a colleague. The table, in the findings, includes five categories and the number of occurrences- with the percentage). The thing is that I don’t know which test to use! I’ve read three books on research and didn’t find what I am looking for. Please help me.
Dear Charles,
I have question regarding paired t-test. If the patients and their spouse will be compared for quality of life, anxiety, and depressiob, can it use paired t-test? If it can, why? Can you give me explanation and citation related my question? Because I still new in statistical course, thank you
Berlian,
Yes, you should use a paired t test to compare any trait between patients and their spouse.
But the t test can only be used to compare one trait. If you have multiple traits, then you could use Hotelling’s T-square test.
The paired t test is used since patients and their spouse are not independent of each other. This is cited in numerous books and websites.
Charles
Hi Charles,
I need your help over below case.
H0: u1=u2 and H1: u1 ≠ u2
And, we have below info.
df = 24, t Stat = -1.5917, P(T<=t) two tail = 0.1245, t Critical two tail = 2.79694, at 10% signficant level.
Should we accept H0?! Because t Stat (-1.5917) is within t critical two tail (2.79694,-2.79694).
Hope to seek your advice. I do not have any example with negative value over t Stat.
Cecil,
1. For a 2 tailed test, due to symmetry of the t distribution, you can use the absolute value of the t statistic. Thus the p-value = T.DIST.2T(ABS(-1.5917),24) = 0.1245 > .10 = alpha, and so you can’t reject the null hypothesis. Note that this doesn’t mean that you “accept” the null hypothesis, just that you are 90% confident in it (which is not the same thing as 100% confident).
2. Note that the two-tailed critical value = T.INV.2T(.1,24) = 1.710, which is not the same as the value you calculated.
Charles
Sorry Charles, I am really a dummy over statistics. And need more clarification from you. Hope you can help me more. Appreciate first.
The case said that “the scores in a mths capability test of 14 randomly chosen male and 14 randomly chosen female. The scores of male and female are normal. Some ppl suspect that the average scores of male and female are different. At 10% significance level, do the data provide sufficient evidence to support that argument?”
And the related info shows:
df = 24, t Stat = -1.5917, P(T aplha = 0.05?
i guess my above comments is trimmed. I guess p-value = .1245 > .05 (=0.1/2)= alph? If p-value<alpha, accept H1? when we accept H0? How many possilbe outcome after we compare p-value against alpha?
next, my understanding over this case should follow normal distribution. t critical (left) = -2.7969 < t stat < t critical (right) = 2.7969 is saftety range for H0. Correct?
Cecil,
The p-value of .1245 is for the two-tailed test, and so you need to compare .1245 WITH .1, not .05. Since .1245 > .10, you don’t have evidence to reject the null hypothesis. You probably want to call this “accepting” the null hypothesis, but this is technically not correct since there is still some doubt about the result. This doesn’t mean that you should accept H1 — far from it. You are 90% confident in the null hypothesis.
There are two outcomes: (1) reject the null hypothesis (i.e. you have evidence for H1) or (2) don’t reject the null hypothesis (i.e. you evidence in favor of the null hypothesis.
As I said in my earlier response, I don’t believe that you have calculated the critical value correctly. If -crit < t < crit, then you can't reject H0. Charles
Cecil,
Based on the results you showed me in your earlier comment, the data does not provide sufficient evidence to support the argument that the average scores of the males and females are different.
Note that this is a two independent samples t test (not a paired t test).
Charles
The sample t test I provided before is not paired because df is not equal to 13. Right?
How the data can provide sufficient evidence to support the argument that the average scores of the males and females are different.
Paired test usually repeats the same sample over before/after test. Here, we have two samples – male/female score? how to link up a pair of male/female score?
Cecil,
You comment is to the paired t test even though you are not performing a paired t test.
You would use a paired t test if the male is the husband of each female.
Charles
Charles
Please would you be able to help me understand my undergraduate dissertation statistics? I am not sure which test I should be doing but have been told to do paired T test. My dissertation is using a blood sample but testing it for two microRNA markers. So blood sample 1 is tested for both marker 1 and marker 2.
Would I be doing paired T test for this? As its not a before and after its two separate markers from the same blood sample
Hope that was understandable.
Kind regards.
Rhian,
Yes, paired t test is applicable in this case even though you don’t have a before and after situation. The key is that is each subject is tested for both markers.
Charles
Dear Sir,
Thanks for your wonderful website !!
I would like a word of advice from you.
Prawns are known to lose weight after fished out of water.
I want to check claim of a firm that its product (weight increasing additive) increases weight of prawn by better water retention.
Following is plan of experiment. Please advice whether it is correct.
All prawns for experiment will be harvested form same pond. All will be in weight range of 28 g to 30 g per individual.
Hypothesis
Ho : μ (without treatment) = μ (with treatment)
H1 : μ (without treatment) ≠ μ (with treatment)
α : 0.05
Without Treatment : In this group, weight increasing additive is NOT added. 1kg prawns and 1liter chilled water is kept in each of 15 tubs. Let us say, this is row A.
With Treatment : In this group, weight increasing additive IS added. 1kg prawns, 1 liter chilled water and weight increasing additive is added (as per dose prescribed by manufacturer) in each of 15 tubs. Let us say this is row B.
Both row A and row B are arranged simultaneously and kept undisturbed for 150 minutes in the same room at same temperature.
After 150 minutes, water is drained and weight gain (in percentage) is noted in prawns in each tub.
For this arrangement, can we consider A1 and B1 as one pair of tubs, A2 and B2 as second pair and so on upto A15 and B15. i.e can we say we have arranged 15 pairs of tubs with each pair having one tub without treatment and other with treatment, all other conditions being same.
Thus, if we apply t test for dependent samples, would it be correct for aim of our experiment ? Or should I apply t test for independent samples ?
Thank you !
Vijay Rathod
Vijay,
If these tubs are separate, then you should use t test for independent samples.
Charles
Once again, Thanks! 🙂
Hello, Charles!
First I would like to thank you for all these great information!
I have one question. I have recently had an assignment and I would like to know if I was right. The assignment was to find out whether there was a significance increase from 2014 to 2015 in the number of visitors in Museum X. As for the data, I had the number of visitors for each month in 2015 and for each month in 2016. I have conducted a t.test for independent samples and created a confidence interval, but now I am starting to think that I was wrong and they were in fact dependent samples.
I would like to ask for your opinion. Do you think that it’s dependent or independent?
And if it is dependent sample, can it also be correct the t.test for independent sample? I read somewhere this “Since the pairing is explicitly defined and thus new information added to the data, paired data can always be analyzed with the independent sample t-test as well, but not vice versa.” and was wondering if it is true.
Thank you!
Alexia,
Since the people being sampled in 2015 and 2015 are not the same, this is an independent sample test.
Charles
Sir,
I am currently working on a questionnaire and I need to measure its reliability.
I’d did a test-retest but I am somehow confused on how to compute for its reliability. I also have some previous undergrad thesis and I saw that they’d used t-test and thrn wilcoxon. I hope you can answer my inquiry. If you need any addntl info I am willing to give it to you. Thank you 🙂
Rinna,
There are various ways of measuring the reliability of a questionnaire: test-retest, Cronbach’s alpha, split-half, etc. See the following webpage for details:
Reliability
Charles
Charles,
I am testing performance of a measurement device, then making a change to the device and repeating the tests on the same device.
The goal is to improve the performance of the device as indicated by increased precision (lower standard deviation of the results on a series of tests after the change).
Each test consists of 6 measurements; each test is repeated 3 times before and after the change.
This results in 3 standard deviation values from the tests before the change and 3 standard deviation values from the tests after the change.
My question is, which t-test should I use to evaluate the results:
Paired sample t-Test since it is the same measurement device?
Two Sample t-Test equal variances if the variances of the two data sets is similar?
Two Sample t-Test unequal variances if the variances of the two data sets is not similar?
Thanks,
Bob
Bob,
What precisely do you mean by “evaluate the results”? In general, the specific test that you use depends on what you are trying to test.
Charles
Charles,
I want to know if the change in performance is statistically significant based on the t-Test. Which t-Test is the correct one to use? By “evaluate the results” I mean calculate the p-value.
Bob
Bob,
The website explains this, but in any case you would need to provide additional information before I could determine which test to use.
Charles
Hi,
I have conducted a pre-questionaire (likert scale) and a post questionnaire (likert scale) comparing confidence levels of a feedback session, both take 4 times over 4 weeks. What analysis do i use on SPSS? sample were the same 14 Males used each time. Many thanks.
Alex,
If you have 14 subjects with a score at time 0 and a score at time 1, then a paired t test could work. If the normality assumption is violated (which could be relevant with likert data), then you could use a Wicoxon signed-ranks test.
If you have more than 2 times, then you can use Repeated Measures Anova or possibly Friedman’s test if the assumptions are violated.
If your situation is different, then I would need more information to provide an answer.
Charles
Hello there.
I am in a graduate stats course and having some trouble. here is my scenario:
Scenario: Dr. White is a geriatric nursing practitioner. He would like to know whether a new treatment compared with the regular treatment makes difference on patients’ memory. After his research proposal was approved by IRB at his institution, he randomly recruited patients from his clinics for the study. Patients who agreed to participate in his study were randomly assigned to either the treatment group or the control group. Patients who were in the treatment group received the new treatment, and patients who were in the control group received regular treatment. Both groups of patients’ memories were tested after four weeks of treatments.
I’m having a hard time deciding if I should use an independent t-test or a paired t-test. These appears to be two independent groups to me however the re-measure of memory makes me want to used a paired t-test. I am using spss software just confused on which test best fits. any suggestions would help. thank you.
Misty,
If you are just comparing patients in the control group with those in the treatment group after 4 weeks, then an independent t test is a fit. If you want to compare the before treatment with treatment after 4 weeks, then the paired t test is correct. If you want to combine both of these tests, then you need a two factor repeated measures Anova. All of these tests are described on the Real Statistics website.
Charles
thank you SO MUCH. this was very helpful.
Please, I am trying to run a t-test to find out the effect on a policy on maternal mortality for the years before the policy and after the policy was implemented. I am not sure which test will give me the needed information.
Ramatu,
You haven’t provided enough information for me to be able to answer your question.
Charles
hi sir ,how to use figure 4 – excel data analysis of paired sample in excel ?
ty
From the Data ribbon, select the Data Analysis option. In the dialog box that appears choose the t-Test: Paired Two Sample per Means option.
Charles
Hi Charles,
Thanks for your great resources here!
I have a question for a data analysis task. I conducted a survey with the following parameters:
>15 Questions
>Each question has the same Likert Scale (1[Strongly Disagree]-5 [Strongly Agree])
>10 respondents
>I ran the same survey prior and after the implementation of a new project model.
How can I apply the paired t-test to evaluate whether a significant improvement due to the new project model has occurred? Am I right if I compare the average values per question in the paired t-test?
e.g. Q1: PRE=3.9 POST=4.3
Q2: PRE=3.5 POST=4.1
The questions would be the measurement variables and the averages the two nominal variables calculated as the average value per question from the 10 respondents.
Or would that be methodologically incorrect?
Thanks a lot!
Lukas,
Glad you like the resources.
Before I can answer your question, I need to understand what hypothesis you want to test. THis needs to be a clear and concise statement.
Charles
Thanks Charles,
Generally, I want to test, if the implementation of a new process has led to improvements in the team. To assess this, I constructed a questionnaire that covers different factors (e.g. collaboration, amount of work, leveraging individual skills).
So as for my understanding of the paired t test for evaluating survey results, each question would be 1 hypothesis that I test?
Lukas,
Possibly, but I would need more information to answer definitely. It might be better to start with Hotelling-s T-square or something else.
Charles
Hi Charles,
I have a very basic question
I’m doing an unpaired t-test for meta-analysis and comparing the % sensitivity in two treatments.
The two means and standard deviations ars compiled from 9 and 12 experiments respectively, and each experiment has from 50-100 subjects.
So what I can’t figure out is, what’s my sample size? Is it the number of experiments I’m running (9 and 12) or the total number of subjects I have (about 1000) in each group?
Thank you in advance.
Lindsay,
If you are comparing the means of the 1,000 or so subjects in each group, then the sample size is about 1,000. If instead you are comparing the means of the means of the 9 to 12 experiments, then it is the 9 to 12 value. In either case you need to make sure that the assumptions of the test are met, especially regarding independence.
Charles
Hi Charles,
If I divide a sample (of say 100 observations) of an index and divide the sample into two samples and calculate the mean for both the subsamples than can I still use the Paired two sample test to compare the means?
No. You seem to be describing a t test with independent samples.
Charles
please the difference between the two standard deviations is not equal to 6.32982,that is 28.56188-24.39262 gives 4.169.so please am a bit confused as to how that figure was arrived.
Daniel,
You don’t want to use the difference between the two standard deviations. Instead you want to use the standard deviation of the differences, namely STDEV.S(D4:D18).
Charles
hi,
i am comparing difference between calories per slice for type 2 and type 3 pizza. i think its independent. can you help me to correct if im doing it right.
Rimaa,
I can’t tell whether you are doing it right, until you tell me what you are doing.
Charles
please I need explanation on how to analyse my data using z test or excel buh I don’t have the SPSS software this is the question
H0:That ICT has no impact on accounting practices
H1: That ICT has impact on accounting practices
50 questionnaires were distributed and 38 were returned in which 20 chose YES and 16 chose NO and 2 chose Not sure
What hypothesis are you trying to test?
Charles
Hi,
In the case of the occurrence of an outlier in the difference score for a paired t-test, how to control for its effect if any ?
Thank you
Takwa,
If the outlier is a real data element and not a typing mistake or error in measurement, then you should not delete it. In this case, provided the assumptions for the paired t test are met, I would simply use the paired t test. If the assumptions are not met, then I would use the Wilcoxon Signed-Ranks test.
Charles
Hi, I have some question..I want to compare body characters measured between female and male of same species of insect..So, I am using independent t test…
I also compare body characters measured between two different species of insect (same genus)..I am using independent t test too…but someone correct me to use pair t test…Is that possible to use pair t test? I need some help..Tqvm for answering me…
From Alex
Alex,
If I was comparing husbands with their wives I could use a paired t test, but if I compare males in general with females in general, then I would use an independent t test. If you are comparing say 100 pairs of insects from 100 different species where each pair consists of a male and a female of the same species, then perhaps a paired t test could be justified.
Charles
Tqvm…
Hi,
Thank you for this informative tutorial.
I wonder if you can help me with something. Using Excel 2010, I’m trying to create a box-plot of the difference scores for 13 clients’ pre- and post- scores on a measure in order to show a visual representation that the assumptions for the t-test hold, namely that the difference scores are normally distributed or at least reasonably symmetric as in Figure 3 above.
Thank you in advance for any help with this.
Lee
Hi
Are we able to use the independent (unequal) test for paired samples? I get two very different results the same data against the unequal variances test and the paired sample test
Benji,
No, you can’t use the independent t test for paired data.
Charles
The information on this site is amazing – thank you.
Question: If I have 30 participants, tested each participant with a performance TASK 1 and performance TASK 2. The data collected, for each participant, is how many correct for each TASK. I am confused – what is the IV? what is the DV? Would it be correct if you completed the paired-sample t-test for this data? Thanks in advance for your help.
Rachel,
Glad that you find the site useful.
Assuming that you are trying to test whether there is a significant difference between the mean TASK 1 scores from the mean TASK 2 scores, you would usually use a paired t test (assuming the assumptions hold, esp. normality). The reason for choosing the paired test is that the same participants answered both tests. The IV is a binary categorical variable with values TEST 1 or TEST 2. The DV is the test score.
Charles
Thank you
Hi Charles,
I have conducted a survey of 2 teachers and 24 students based on a set of maths questions. I asked students to rank 10 questions on a scale of 1-10 and for their teachers to also rank the questions from their students perspective. Would you recommend a two sample T-Test with Equal or Unequal Variance? Also, if I was to just analyse the data between students or teachers, what type of test would you recommend?
Thank you!
Warren,
It seems like you have too many factors to use a t test. Before I can make any recommendation I need to understand your objective better. What exactly are you trying to test? It wouldn’t be surprising if any two people have different rankings for 10 questions. How can you determine whether the rankings are close or far apart? What is the relationship between the students and the teachers?
Charles
Hi Charles,
I have a question-how to fiind the critical value for a paired-sample sign test? Is any function in excel available for that? I know there is a table from which we can find what we want, however that is some inconvenient.
Would you please explain the question when available? Appreciate your help in advance.
Steven
Steven,
Just as for the paired t test, you first take differences between the pairs in the sample. Then you perform a single sample test, for the sign test, you use the binomial distribution, as described in the following webpage:
https://real-statistics.com/non-parametric-tests/sign-test/
Charles
Hi Charles,
Thanks for your explanations. Just want to clarify some key points of sign test.
1)When n≤25, we can:
a. use BINOMDIST.test to calculate P and then compare it with P0, or
b. find the critical value from the sign test table and then compare it with the test statistic
to decide to reject or fail to reject H0.
2) When n>25, we can find the critical value z0 from the standard normal table and then compare it with the test statistic z to decide to reject or fail to reject H0.
And, a paired-sample sign test is similar to a single sample sign test as above.
Correct me if I got anything wrong, please.
Best withes
Steven
Steven,
What you said is basically correct, but I have the following observations:
1. You can always use the binomial test, whether n is bigger or smaller than 25. For values of n sufficiently large (say n > 25) the normal distribution is a good approximation for the binomial distribution and so you can use it instead.
2. The table of critical values is probably the table of critical values for the binomial distribution (essentially the values of CRITBINOM in Excel)
3. I assume that by P0 you mean alpha.
Charles