Objective
In Dealing with Familywise Error, we describe some approaches for handling familywise errors. We now show how to apply these techniques when multiple paired t-tests are performed.
Example
Example 1: A new drug is being tested for its effectiveness over a period of 4 weeks (T1 = baseline, before the drug is administered, T2, T3, T4 = week of first, second, and third treatments, respectively). The measurements are shown on the left side of Figure 1.
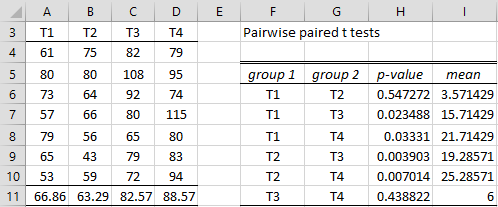
Figure 1 – Pairwise paired sample t-tests
With 4 treatments, there are C(4, 2) = 6 pairs of measurements (as shown in range F5:G11). A paired sample t-test can be performed for each of the 6 pairs, with the p-values mean differences shown in columns H and I respectively. From the data in range F6:H11, we can perform any of the multiple comparison tests described in Dealing with Familywise Error.
In particular, we can use the One Repeated Measures ANOVA data analysis tool to create the p-values shown on the right side of Figure 1. This is done by pressing Ctrl-m and selecting the Analysis of Variance option and then the One Repeated Measures ANOVA option from the dialog box that appears (or from the ANOVA tab when using the Multipage interface). In either case, fill in the dialog that appears as shown in Figure 2.
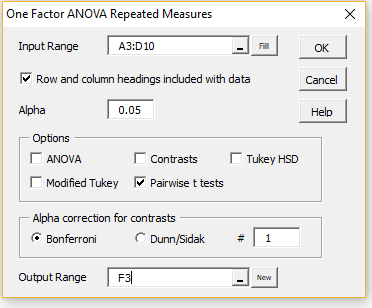
Figure 2 – Selecting the Pairwise t-tests option
The output is shown on the right side of Figure 2.
References
Howell, D. C. (2010) Statistical methods for psychology (7th ed.). Wadsworth, Cengage Learning.
https://labs.la.utexas.edu/gilden/files/2016/05/Statistics-Text.pdf
Wikipedia (2018) False discovery rate
https://en.wikipedia.org/wiki/False_discovery_rate
Well explained!
I have compared 20 chemical parameters in two groups of water using Welch’s t-test. Thus, I have got 20 p-values. Do I have to correct my p-values for multiple comparisons? Grateful for a reply!
Bernard,
It depends on your objective, but yes you probably need to correct for familywise error.
Charles
So informative, thank you