On this webpage, we show how to use Spearman’s rank correlation for hypothesis testing. In particular, we show how to test whether there is a correlation between two random variables by testing whether or not the population Spearman’s rho = 0 (the null hypothesis).
Hypothesis Testing
For sufficiently large sample sizes (generally about n > 10), Property 1 of Correlation Testing via t Test and Property 1 of Correlation Testing via Fisher Transformation can be applied using Spearman’s rho in place of Pearson’s correlation r. For low values of n, we can use the table of critical values, described in Spearman’s Rho Table.
In general, however, Kendall’s tau is often the preferred non-parametric approach since it has more desirable statistical properties.
Example
Example 1: Repeat the analysis for Example 1 of Correlation Testing via t Test using Spearman’s rho, i.e. test whether Spearman’s rho is significantly different from zero based on the sample data in range B4:C18 of Figure 1.
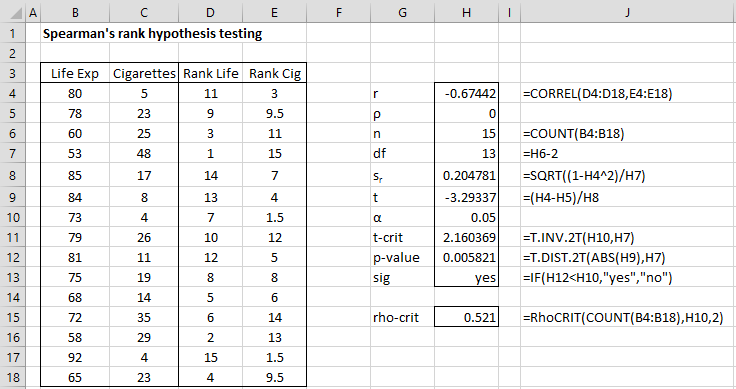
Figure 1 – Hypothesis testing of Spearman’s rho
Spearman’s rho is the correlation coefficient on the ranked data, namely CORREL(D4:D18,E4:E18) = -.674. Alternatively, we can compute Spearman’s rho using the Real Statistics formula =SCORREL(D4:D18,E4:E18).
We now use the table in Spearman’s Rho Table to find the critical value of .521 for the two-tail test where n = 15 and α = .05. Since the absolute value of rho is larger than the critical value, we reject the null hypothesis that there is no correlation.
Results using a t-test
Since n = 15 ≥ 10, we can use a t-test instead of the table. By Property 1 of Correlation Testing via t Test, we use the test statistic
![]()
Since |t| = 3.29 > 2.16 = tcrit = T.INV.2T(.05,13), we again conclude there is a significant negative correlation between the number of cigarettes smoked and longevity. You can find the details of the analysis on the right side of Figure 1.
For Excel 2007 users, replace the formula in cell H11 by TINV(H10,H7) and the formula in cell H12 by TDIST(ABS(H9),H7,2).
Observation: To conduct a one-tail test using the table in Spearman’s Rho Table, you need to double the value of α.
Confidence Interval
For a binormally distributed population, we can calculate a 1–α confidence interval as follows based on the standard error estimate described in Spearman’s Testing using a Fisher Transformation.
- Use the Fisher transformation (see Correlation Testing using a Fisher Transformation) to map Spearman’s rank correlation coefficient r to a normally distributed statistic z.
- The 1–α confidence interval (zlower, zupper) for z is then

where zcrit = NORM.S.INV(1-α/2).
- The 1–α confidence interval (rlower, rupper) for r is now obtained by setting rlower equal to the inverse Fisher transformation of zlower and setting rupper equal to the inverse Fisher transformation of zupper.
For Example 1, the calculation of the 95% confidence interval for Spearman’s rank correlation coefficient is shown in Figure 2.
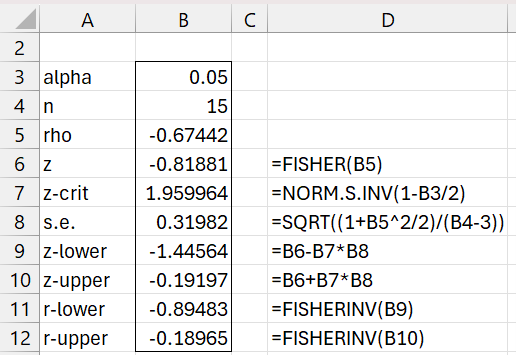
Figure 2 – Confidence Interval
Worksheet Functions
Real Statistics Functions: The Real Statistics Resource Pack provides the following worksheet functions:
RhoCRIT(n, α, tails, h) = the critical value of the Spearman’s rho test for samples of size n, for the given value of alpha (default .05), and tails = 1 or 2 (default). If h = TRUE (default), the function uses harmonic interpolation; otherwise linear interpolation is used.
SCORREL(R1, R2, lab, tails, alpha): an array function that outputs a column array consisting of Spearman’s correlation coefficient (rho), the t-statistic, the p-value which tests the null hypothesis that rho = 0, and the lower/upper ends of a 1–alpha confidence interval for rho. If lab = TRUE, then a column of labels is added to the output (default is FALSE). tails = 1 or 2 (default), alpha = significant level (default .05)
For Example 1, RhoCRIT(15, .05, 2) = .521, as described above.
For Example 1 of Spearman’s Correlation, the array worksheet formula =SCORREL(B4:B18,C4:C18,TRUE) returns the output shown in Figure 2.

Figure 3 – Output from SCORREL function
Links
Examples Workbook
Click here to download the Excel workbook with the examples described on this webpage.
References
eGyanKosh (2017) Unit 2: other types of correlation
http://egyankosh.ac.in/bitstream/123456789/20956/1/Unit-2.pdf
Wikipedia (2015) Spearman’s rank correlation coefficient
https://en.wikipedia.org/wiki/Spearman%27s_rank_correlation_coefficient
NCSS (2012) Confidence intervals for Spearman’s rank correlation
https://www.ncss.com/wp-content/themes/ncss/pdf/Procedures/PASS/Confidence_Intervals_for_Spearmans_Rank_Correlation.pdf
Charles,
I see my mistake. Still, when I enter =RhoCRIT(40,0.05,2,TRUE) I get #N/A.
Joe
Hi Joe,
This is because the table only goes up to 30 (and not 40). See
https://www.real-statistics.com/spearmans-rho-table/
Charles
Hi Charles
When I enter =RhoCRIT(40,.05,2,h) I get two error messages. The first is “Microsoft Visual Basic/Can’t find project or library,” and the second is “Project is locked/project is unviewable.” SCORREL works fine. What am I doing wrong? I’m using Excel 365
Hello, when I tried to use SCORREL(array1, array2,) it works fine and outputs the value but when I use any of the variations SCORREL(array1, array2, TRUE), SCORREL(array1, array2, 1), SCORREL(array1, array2, 2), SCORREL(array1, array2, TRUE, 2, 0.05), the only output is just the word “rho”
Is there any way to fix this problem or am i doing it wrong?
Regards
Hello Allan,
SCORREL is an array function and so to see the rest of the output see
Array Formulas and Functions
Charles
Hello Mr. Charles
I don’t know why the other values are still not showing. For reference this is what I type:
=SCORREL(A1:A106, B1:B106, TRUE, 2, 0.05) and the other variations of it. I tried using both Ctrl-Shift-Enter and Enter only but the same results of just “rho” comes out.
Thank you so much. I’m now able to make it work. =)
Hello,
When I use “=SCORREL()” on my two variables, I get 5 values. For example:
rho = -0.4700
t-stat = -3.6888
p-value = 0.0006
lower = -0.6703
upper = -0.2058
How do I interpret the results?
There is a weak negative monotonic association between the ranks (-0.4700) and the results are statistically significant (t = -3.6888, p = 0.0006). Is this the right way?
Also, how do I know if the test is one- or two-tailed?
In other words, do I have to run any other calculations to show whether the rho is statistically significant, or is the “=SCORREL()” already giving me all that (as I understand it does)?
I apologize if it’s a dumb question, but I would appreciate it you could confirm it. Many thanks.
PS: I might have posted the same question in the wrong section. Apologies for that.
Reply
Hello,
Yes, what you stated is correct. Spearman’s correlation is -.4700 which is significantly different from zero. This is a two-tailed test (that is why the lower and upper 95% CI values are given). Not a dumb question. I removed the comment from the other section.
Charles
Dear Mr. Charles, I truly appreciate your taking the time to answer my questions. I never thought I would be able to learn how to use either Excel or statistics, but this website has been a treasure trove for me. Many thanks and a good day.
Thanks for your truly kind words.
Glad I could help.
Charles
Dear Mr. Charles,
It seems that I could use your assistance again, if I may.
How could I chart the Spearman’s rank correlation in excel? I used the “=scorrel()” function to calculate it. I thought I could create another column that contains the rank difference between the x and y. Then, I plotted this column in a scatter plot. Is that valid? Thank you.
Hello Mihail-George,
You can certainly do this. How do you plan to use this scatter plot?
Charles
4. I tried using the SCORREL function on my dataset, both on the raw data and ranked, but get an error message. The columns I am using do not have equal entries. I am not sure why I have gotten this error and hoping you might be able to help.
The datasets I am working with have a non-normal distribution which is why I selected this correlation test as opposed to others. I have a few different factors I wish to test association for but am comparing two at a time as it appears the Spearman rank can only do two at a time based on my understanding (which I hope is correct).
Thank you.
KJ
KJ,
The datasets must have the same number of elements.
Charles
Hi Charles,
Thanks very much for your replies, much appreciated.
3. I’ve seen reference to R1 or R2 a few times and just wanted to confirm what this means exactly. I looked on several pages and read through them several times and I think it refers to a column of ranked data. Is this correct?
3. Throughout the Real Statistics website R1 and R2 refer to two arrays or cell ranges. In general, the data does not have to be ranked nor be a column array.
Charles
Hi Charles,
I have a few questions on Spearman Rank correlations which I am hoping you can help me with:
1. Do the two sets of data you are comparing (two columns of data) need to have the same number of entries? Or can you have one column that has 50 values and another column that has 10, for example? If they can be different, is there a limit on how different they can be (i.e. only 20 entries different) ? — I am thinking not but wished to confirm this was the case.
2. Can you confirm if when I am using the Real Statistics SCORREL function, I should perform that function on the raw data or do I have to rank it first? I saw on the main Spearman Rank page you have used the SCORREL function on the raw data, but on this page you show the SCORREL function using the ranked data. Does it make any difference? And could you just explain why or why not?
Kj,
1. The sizes of the two data sets must be equal. Correlation (including Spearman’s rank correlation) is calculated based on pairs of data values.
2. SCORREL does not require that the data consists of ranks. If the data is already ranked, you can calculate Spearman’s rank by using CORREL or SCORREL. You will get the same result.
Charles
Hello, I seem to have an anomaly here, as I did get different results between SCORREL and CORREL. And the CORRELATION tool from the Data Analysis ToolPak agrees with the CORREL value. Would you mind explaining what could have gone wrong? Thank you.
SCORREL outputs Spearman’s Rank Correlation, while CORREL outputs Pearson’s Correlation. THese are not the same thing and so you shouldn’t expect to get the same result.
CHarles
Dear Charles, thank you for your reply.
Dear Charles,
Thanks for showing the steps. I have one question. Can you please guide me how to actually calculate 95% confidence interval in Excel for the calculated rank correlation?
Hello Arhum,
A confidence interval for the Spearman’s rank coefficient is not currently described on the website or supported by the Real Statistics software. I will add this within the next week. Stay tuned.
Charles
Hello,
I have a very low correlation for Spearman’s (-0.0005), and tcrit>t using a 95% confidence interval (I have a very large sample set of over 300 so I have used the t version to test).
What does this mean? Does it mean that there is a weak correlation but that it is not statistically significant and there may actually be a strong correlation?
If that is the case, how would I test to determine correlation?
Jessica,
The correlation (at least Spearman’s version of the correlation) is quite close to zero (-.0005) and statistically this is not different from zero.
Charles
Hello and Thank you for the valuable information,
Is it possible to perform Speraman’s rho or Kendall tau when more than one cells contain 0 as a response? For example,when correlating age with number of car accidents
Greg,
Yes, the data can contain zero. Why would you be concerned about this?
Charles
Thank you for the information,
I’m experiencing a problem that Excel only shows the ‘rho’-output when I use SCORREL. It doesn’t show t-stat or p-value.
I can see those values are calculated when I check the formula in ‘Insert Function’, but the values just don’t show at the excel-sheet
Clicked post to soon…
To finish my question, can you help me showing the compleet output?
Thank you very much in advance!
Hi Ellen,
SCORREL is an array function and so you can’t simply press the Enter key to get all the output. See the following webpage for how to get all the output:
Array Formulas and Functions
Charles
Using the command in finding the t-value, p-value and rho-crit…the result would give an error…what shall I do with this?
If you email an Excel file with your data and results, I will try to figure out what is going on.
Charles
Hello Dr. Zaiontz,
Thank you so much for such a great tool. Could you kindly let me know whether there is a way to show the output from SCORREL function in a horizontal table instead of a vertical table (e.g. rho, t-stat, p-value shown in N14, O14, and P14 instead of N14, N15, and N16 in Figure 2) ?
Hello Lisa,
=TRANSPOSE(SCORREL(B4:B18,C4:C18,TRUE))
Charles
Good morning sir. Can you teach me the traditional method of hypothesis testing using spearman rank order correlation coefficient? There are six steps then, I am confused on the 3rd step which is the test statistic., what formula to use. Then first of all its assumption. Then the 4th step which is the statistical decision wherein there are 3 methods the critical value, p value and the confidence interval method amd last step is interpretation or drawing conclusion. Can you show me this by giving me a problem that answers all these steps and comparing the answers using excel form. Thank you.
Hello Stella,
I don’t know what the 6 steps are that you are referring to nor what are the 3 methods of critical values. Can you please explain?
Charles
Hello Charles,
I am trying to do this for anywhere from 100-150 pieces of data. Is this too large of an n to use? I know I am coming up with an error message when using the RhoCrit function, but it seems that it will work if I can cut it down to 25-30 values.
Thanks!
Chris,
You can use the test for large values of n, but for such large values of n you can’t use the table of critical values. Instead you need to use the t test. This is shown in Figure 1 and is explained a few paragraphs after the figure.
Charles
“but for such large values of n you can’t use the table of critical values”
Could you give me a reason why it is like this? Didn’t the table also calculated based on the same parameters? Or it is just simply that the table usually doesn’t contain the results of lager n value?
Thanks!
Hello Zihan,
Yes, you are correct. The table doesn’t contain values for larger n. For larger n the approaches described on the webpage
are sufficient, which is why the table probably wasn’t extended to these larger values of n.
Charles
Hello Charles Zaiontz,
Thank you for creating these files. I am using the Excel 2016 and the realstats excel file. My goal is to calculate the critical value for Spearman’s rho. I did install the realstats excel file through Add-Ins. The =rhoCRIT function does not work for me. In Excel, I used =rhocrit(count(,alpha,2). I don’t know what to type after 2, so I close with a closing parenthesis. If I type in TRUE after the 2, I still get pound VALUE. Then, Excel tells me there is a compile error and then asked for a password. I would love for this to work. Please advise.
Faizan,
The formula should take the form RhoCRIT(COUNT(R1),alpha,2).
Regarding the compile error, when you press Alt-TI do you see RealStats and Solver on the list of addins with a check mark next to them?
Charles
walid, no need to for publicity of your MSc, Ph.D. You could’ve simply said Thanks
Thank you, Charles. I have seen some people on the website discuss that Spearman’s rho can be used to evaluate the correlation between continuous and categorical data(Here is the address: https://stats.stackexchange.com/questions/102778/correlations-between-continuous-and-categorical-nominal-variables# ), I should recommend them to visit your blog 🙂
Niki,
When X is a continuous variable and the categorical variable Y is dichotomous, you can calculate the correlation between the ranks of X and Y. Hypothesis testing in this case is probably equivalent to the Mann-Whitney test.
Charles
Hi, thank you very much. But I have a question, how to use spearman’s rho to evaluate the correlation between continuous and a categorical. How to rank categorical data? And if the rank is same, for example, class_1 ranks 1, class_2 ranks 0, how to distinguish two variables if their rank is same even though their true are different.
I’m stocked here for a long time. If you have some ideas, hope to get your reply. Thanks, sincerely.
Niki,
By definition, categorical data can’t be ranked. Only data which is at least ordinal can be ranked.
Charles
Hi!
Thanks for such a great site! I have been able to use SCORREL(R1,R2) to calculate the spearman rho correlation coefficient; however, when I try to generate the p-value using SCORREL(R1, R2, TRUE), the only thing that comes up is the word “rho” in one cell, and no other cells.
How can I fix this?
Gayatri,
This is because SCORREL is an array function. To see the other values, please look at the following webpage:
Array Formulas and Functions
Charles
Hi,
I’ve used your website for several stats conundrums and I just want to say thank you for explaining everything so thoroughly with such clear examples! I thoughts stats was just something I couldn’t do until I started using your tips in excel. I truly appreciate it!
Carrie,
This is great news. I am very pleased that the website has been helpful to you.
Charles
Hi! Thanks for a great tool + instructions! I noticed that SCORREL spits out the error message #VALUE! when the rank of parameters x and y are the same and the spearman rho is 1.0. What does this mean? Is it not possible to calculate a p value if the correlation is supersignificant? How do I interpret/report this? Perhaps the issue is that I am working with n < 15? Would it be more useful to perform a different type of test?
Many thanks,
Jana
Jana,
With the data I am using I don’t see an error value.
If you send me an Excel file with your data and calculations I will try to figure out what is going on.
You can find my email address at Contact Us.
Charles
Hi Charles,
I followed the installation process and successfully added RealStats-2007. However,
it doesn’t show on my Add-Ins. The Solver doesn’t show either. I cant figure what the problem is since both add-ins appear as Active Add-Ins at Windows Button….Excel Options…..Add-Ins. I have been using SigmaPlot and “Resampling Stats for Excel” add-ins for several months.
I need some help.
Eugene,
When you say that Solver doesn’t show on your Add-Ins, are you referring to the list of addins that is displayed when you press Alt-TI? It would would surprising that Solver doesn’t show on this list at all.
Charles
Hi Charle,
Really you’re doing a great work.
I would participate and suggest a formula to get the exact rank.
In cell D4 the formula is:
=((COUNTIF(B$4:B$100,”=” & B4)*(COUNTIF(B$4:B$100,”<" & B4)+1))+((COUNTIF(B$4:B$100,"=" & B4)))*(COUNTIF(B$4:B$100,"=" & B4)-1)/2)/COUNTIF(B$4:B$100,"=" & B4)
In cell E4 same formula just replace column B with C
Pls try it and let me know your view point.
Thanks
Abdelkader,
Sorry, but when I use this formula I get an error message.
Charles
Dr. Buenas noches, escuseme, como puedo determinar la correlación de Spearman con tres o más variables?.
Dr Good evening, excuse me ¿how can I do a Spearman Correlation with three or more variables?
Gerardo,
To calculate the Pearson’s correlation for three or more variables you can use the Real Statistics RSquare(R1,j) function as described on the webpage
https://real-statistics.com/multiple-regression/multiple-correlation-advanced/
To do the same thing for the Spearman’s correlation, first you could use RANK.AVG (or RANK_AVG for Excel 2007 users) to get the ranks of the data elements (range R1) and then use the RSquare(R1,j) function.
Alternatively, you can perform multiple linear regression on the ranked data.
Charles
Dr thank you very much
The =SCORREL($L$22:$L$37;Q22:Q37;TRUE) just returns “roh”, but not all the values and fields. Am I using it wrong?
Anyway, Thank you for the Statistics Package.
Jan,
SCORREL is an array function which outputs multiple cells. You need to highlight a multiple cell range and press Ctrl-Shift-Enter. See the following webpage for more details:
Array functions and formulas
Charles
Thank you for your help. I didn’t know that function.
The knowledge shared is so much helpful. Keep it up.
As a Lecturer in the Statistics department I do appreciate.
By Narris Twesigye.
How does one interpret the spearman statistical test result if the statistical p-value is equal to the alpha value (i.e. statistical p=0.05 while alpha=0.05) although the spearman rho calculated (absolute) is found to be less than the tabulated (critical) spearman rho?
Mary,
The value of alpha = .05 is a somewhat arbitrary number, and so in any case, the best thing is to simply report the p-value without worrying too much as to whether it is a significant result or not. It is obviously significant for alpha of.051 and not significant for alpha of .025.
Regarding the critical value, what was your calculated Spearman’s rho value and what did the table say was the critical value? Given a p-value of .05, I presume that the calculated and critical rho values are almost the same. If not, probably something is wrong.
Charles
Charles,
(re-posting as the punctuation messed it up.)
Thanks for a great website – I am making my way through it. You make a complex subject easy to understand.
I am puzzled by this example of life expectancy and cigarettes in figure 2. As I understand it H0 is that they are uncorrelated. The alpha is 0.05 and the p-value of the spearman rho statistic is 0.005821. By comparing the t stat to the critical t you conclude that H0 should not be rejected as t stat is less than t crit (i.e. they are uncorrelated). Clearly they are correlated as a simple xy graph will show. Should you not be comparing H12 to H10 and concluding that it is significant and rejecting the null hypothesis. Elsewhere on your website for significance you talk about comparing abs(rho) to rho-crit in order to check for significance and clearly here abs(-0.674) greater than 0.521 so it is significant. Should you be comparing abs(t stat) to t-crit?
Or have I mis-understood something here?!
Thanks again for a great website.
In your comment you state that “By comparing the t stat to the critical t you conclude that H0 should not be rejected”.
I don’t see where this is stated. On the webpage I clearly state that the null hypothesis should be rejected.
Charles
Charles,
Sorry I wasn’t very clear. In figure 2 above in cell H13 the result is ‘no’ for significance.
Yes, you are correct. I have now replaced Figure 2 with one that contains the correct formula. Thanks for identifying this error.
Charles
Dear Sir
please tell me what should be the answer if values remain same. i mean if i take values 1,1,1,1,1 for variable A and 1,1,1,1,1 for variable B in spearman rho correlation.
It will be undefined since the variance of each sample is 0 and so the denominator of the formula used to compute the correlation coefficient will be zero.
Charles
Hi Charles. Thanks for making Real-Statistics available to all. Do you know of a way to use SCORREL when there are missing data? For example suppose we have want to calculate SCORREL(A5:A19,B5:B19,TRUE) but we delete the observation in cell B10. Is there an easy way to do this? I can revise to SCORREL((A5:A9,A11:A19),(B5:B9,B11:B19),TRUE) to do the calculation but I have 100s of correlations to calculate and there are random missing values scattered throughout my data set. Any thoughts would be appreciated. Thanks, Tim.
Tim,
Suppose your data is stored say in range A1:B100 and you are trying to calculate SCORREL(A1:A100,B1:B100). Highlight range D1:E100 and enter the array formula =DELROWBLANK(A1:B100) in the highlighted range and press Ctrl-Shft-Enter. The result will be the same data with any pairs with one or two empty cells removed. Now suppose 10 rows were removed (thus the range D91:E100 contains #N/A). The result you are now looking for can be calculated using the formula =SCORREL(D1:D90,E1:E90).
You can also use the Reformatting a Data Range by Rows data analysis tool to remove rows with empty cells.
The above assumes that missing data is equivalent to empty cells. If instead missing data is equivalent to some non-numeric value (e.g the word “missing”) then you would use the array formula DELROWNonNum instead.
In a future release I will automatically remove non-numeric entries from the data before calculating SCORREL.
Charles
Thank you Charles, but could you tell me how exactly can I use SCORREL function to correlate the questionnaire and the observation?
Veton,
The referenced webpage describes how to use the SCORREL function or the Correlation data analysis tool to show the correlation between between two paired data sets. If you need need further information, you need to explain further what additional information you need.
Charles
Hi! Could somebody please help on my Master`s thesis I am doing. I have an observation instrument and a questionnaire to compare and make a correlation between them based on some categories and points. I need Spearman`s correlation function to do this in Excel 2007. I would be so grateful if you could help me.
You can do this as explained on the referenced webpage. In particular, you can use the SCORREL function found in the Real Statistics Resource Pack. There is a version for Excel 2007 which you can download for free.
Charles
Excel freezes everytime i try using the =Scorrel function!! i really do need it, what should i do?? thanks!
Richard,
If you send me an Excel spreadsheet with your data, I will try to figure out what is going wrong. Send it to czaiontz@gmail.com. Also which version of Excel are you using?
Charles
Charles,
I’m experimenting with the Spearman Rho, using ranked data that contain ties. The examples given in text books use rank date with no ties. My interest is comparing the rho value using SCORREL and the conventional 1-sum(d^2)/n(n^2-1) formula.
Thanks
Dan
Dan,
I have not tried to make such a comparison, but would be interested to in hearing what you discover.
Charles
Hello. Actually I think I have met the problem with ties of Spearman rho evaluating replicated experiments: having 5 concentration levels and each of them measured 8 times, I have got two fourty-row columns (40 experimental points), where the concentration levels (x) were 8 times the same. Then Spearman’s rs deviates as follows: -0.835 using the function =correl() and -0.799 applying the formula 1-6*sum… If I took just 5 points from the data set (no replicated concentration levels), the two algorithms give the same results (-0.700); selecting 10 points (1 replicate) I got -0.788 vs. -0.761; for 15 points (2 replicates) I got -0.818, and -0.786 resp.
Hello Jiri,
Recall that the formula 1-6*d… is only valid when there are no ties.
Charles
Dear Charles,
The clarity of your presentation and examples combined with the comprehensive cross-referencing of all relevant techniques make your site a real winner. After 25 years without touching stats it has been a tough week getting back into it. I have fought with the examples on many other sites but the simplicity of your presentation has allowed me to quickly overcome the hurdles I had faced elsewhere. Thank-you for your outstanding work,
Mart
i am now doing a proyect based on spearman and i have come to a problem, what should i do if i have only one sample instead, i have nothing to compare that sample with. i was wondering how could i calculate it, if its possible to do so.
thanks
Natalie,
Correlation coefficients such as Spearman’s only make sense if there are at least two data sets. Sorry, but I don’t know of any way to calculate this coefficient with only one sample.
Charles
Sir, the command for finding critical value of t statistic ie.RhoCrit do not work if n= 4:30. Please give suggetion, because it takes more time to get critical value in other way.
Lalit,
I just tried =RhoCRIT(4), =RhoCRIT(5), …, =RhoCRIT(30) and they work perfectly. They generate the values found in the table shown on the webpage https://real-statistics.com/statistics-tables/spearmans-rho-table/.
What version of the Real Statistics Resource Pack are you using? You can find this out by entering the formula =VER() in any cell.
Charles
Sir, thank You for such perfect resource!
Just one question. Sir, in case of significant amount of the connected ranks does the spearsman rho show still correct result? Starting from which number of connected rank groups the correction for spearsman rho coefficient should be applied? or it will be not applicable at all?
Kate,
By connected ranks do you mean tied ranks?
Charles
Yes, could you please explain how you would do this if there are tied ranks in one of the values. I know there is a formula, but I don’t understand how exactly you would substitute values into that formula.
Lily,
If there are no ties you can use Property 1 of the referenced page to calculate Spearman’s rho. The more ties, the less accurate the results.
Even if there are ties, however, you can use the approach shown in Example 3 of the referenced page (using RANK.AVG and CORREL). I believe this approach produces the correct result even if there are a lot of ties.
Charles
Kate,
If there are no ties you can use Property 1 to calculate Spearman’s rho. The more ties, the less accurate the result. In any case you can use the approach shown in Example 3 of the referenced page. I believe this approach produces the correct result even if there are a lot of ties.
Charles